Better-than-expected results from bellwether tech companies kept the rally intact despite Apple disappointing, as MoneyShow’s Tom Aspray takes a closer look at the opportunities in the sector.
The focus Wednesday was on the tech sector as the much better than expected earnings from International Business Machines (IBM) and Google, Inc. (GOOG) helped to keep the major averages in positive territory.
The SPDR Dow Jones Industrial Average (DIA) closed well above the September highs and is now just 3.2% below the all-time high of $141.95. IBM makes up just over 11% of DIA so its 4.4% gain was a big factor. As I noted yesterday I am not currently concerned that the Dow Industrials have not yet confirmed the new highs in the Dow Transports.
The weekly technical outlook for the Powershares QQQ Trust (QQQ) is still negative though it got a boost yesterday from both Google, Inc. (GOOG) and Apple Inc. (AAPL), which make up 6% and 15% of QQQ. Today could be a different story as AAPL was down 10% in after-hours trading in reaction to its earnings disappointment.
Later today Microsoft Inc. (MSFT) reports its earnings and then next week we get the earnings from Amazon.com Inc. (AMZN). They make up 7.3% and 3.8% of the QQQ respectively, but are they going to follow Google Inc. (GOOG) or Apple Inc. (AAPL)?
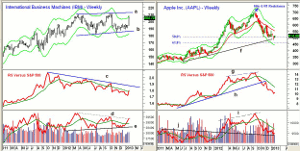
Chart Analysis: The strong action in International Business Machines (IBM) suggests that the weekly trading range, lines a and b, is likely to be resolved to the upside.
- IBM is already back to its weekly starc+ band with next major resistance in the $211.80-$212.80 area.
- A completion of the trading range would give upside targets in the $248-$254 area.
- The weekly relative performance looks ready to close above its WMA this week.
- A move in the RS line above the resistance at line c, will signal that IBM is now a market leader.
- The weekly on-balance volume (OBV) looks even stronger as it is very close to breaking through its resistance at line d.
- The OBV has been above its WMA for the past few weeks after holding support at line e.
- IBM gapped above its quarterly pivot at $197.54 on Wednesday with further support at $196.35.
Apple Inc. (AAPL) is trading around $467 two hours before the NY opening on Thursday, which is down over 9% from Wednesday’s close. The 61.8% Fibonacci retracement support, calculated from the 2011 low is at $461.25.
- This puts prices below the monthly starc- band while the weekly starc- band is at $447.
- The highs from late 2011 area and further support are at $426.
- The weekly uptrend, line f, was slightly broken last week.
- The weekly relative performance broke its uptrend, line h, last November after it confirmed the highs
(line g). - The weekly OBV made convincing new highs as AAPL was testing its quarterly R2 level last September.
- The OBV violated is WMA in the middle of October and is already back to long-term support at line j.
- There is resistance now in the $500-$515 area.
NEXT PAGE: 2 Tech Titans Set to Report
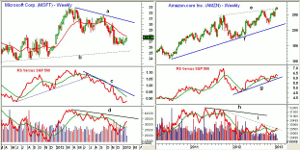
|pagebreak|Microsoft Corp. (MSFT) has been lagging the S&P 500 since early in 2012 as its stock was only up 2.8% in 2012 but it does currently yield 3.1%.
- MSFT has rallied from its recent low at $26.28 but is still below the 20-week EMA at $27.95 and the quarterly pivot at $28.04.
- MSFT spent the majority of the last quarter of 2012 under the quarterly pivot of $29.88, which was a sign of weakness.
- The relative performance broke its uptrend in June and has since clearly been in a downtrend as it has stayed below its WMA.
- The downtrend in the RS, line c, needs to be overcome to signal it is becoming a market leader.
- The weekly OBV is positive as it has moved back above its WMA but is still below resistance at line d.
- The daily RS and OBV (not shown) show more signs of bottoming.
- There is initial support at $27 and then at $26.50.
Amazon.com Inc. (AMZN) reports earnings on January 29 and its stock has done well since it bottomed in mid-November at $218.18, as it is up almost 23%.
- The weekly chart shows that the upper trend line (line e) is now being tested.
- The quarterly R1 at $274.22 was tested this week.
- The relative performance is still in a solid uptrend from the early 2012 lows, line g, and is holding above its WMA.
- The OBV formed multiple weekly negative divergences in 2011, line h, and this downtrend is still intact.
- The OBV is now just testing its short-term downtrend, line i, and is diverging from prices.
- The daily studies (not shown) are now neutral.
- There is initial support now at $262-$260 with more important at $246.20, which is the quarterly pivot.
What it Means: Overall, there are no signs yet that the technology sector is bottoming but there are still opportunities. Let’s look at them individually.
The technical action of IBM does suggest it will make another push to the upside but I would wait for a decent pullback to buy.
The selling in AAPL appears to be overdone, but until there are new positive signs from the daily technical studies, I would stay on the sidelines.
Though the RS analysis for MSFT indicates it is not yet a market leader, the OBV looks much better. Therefore even if its earnings disappoint it is likely to be well supported at lower levels. This combined with its attractive yield makes it a worthy addition to the growth and income part of one's portfolio.
The technical action for AMZN suggests its earnings next week may disappoint the market and I have no new recommendation.
How to Profit: For International Business Machines (IBM), I would go 50% long at $200.60 and 50% long at $198.12, with a stop at $187.54 (risk of approx. 5.9%).
For Microsoft Corp. (MSFT), I would go 50% long at $26.94 and 50% long at $26.70, with a stop at $25.48 (risk of approx. 5 %).


