As the market continues to trade sideways during earnings season, MoneyShow's Tom Aspray takes a look at a sector about to enter a seasonally strong period and an attractive stock in that sector.
Another mixed session for stocks on Wednesday as the Dow was hit hard by the 3.3% drop in Boeing Co. (BA). The earnings so far this week have been a plus for the market but it will get another test today. Citigroup (C) and Bank of America (BAC) report before the bell and Intel Corp. (INTC) reports after the close.
It may take much better than expected earnings from Intel Corp. (INTC) to change the negative sentiment on the tech sector. The declines in the broad market, like the S&P 500, have been well supported. A strong close above the recent highs will confirm that the correction is over and punish the market skeptics.
Energy was one of the worst performing sectors in 2012 as the Select Sector SPDR Energy (XLE) was up just 7.4% in 2012. This lagged well below the 17.1% gain in the Spyder Trust (SPY). So far in 2013, XLE has done a bit better than SPY but the relative performance analysis has not yet confirmed that it is a market leading sector.
The daily technical picture for the March crude oil contract oil turned positive in the middle of December. It is up 10% from the early December lows, while XLE is up 6.7% from the December 31 low. A look at the seasonal tendencies for crude prices suggests that the energy sector may soon catch up with crude oil prices.
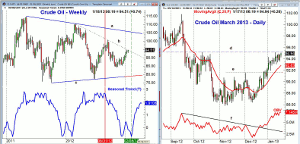
Chart Analysis: The weekly chart of the crude oil contract reveals that it has a seasonal tendency to form a secondary low on February 8. The chart shows that it typically forms an initial high in April and then a final top in late August.
- This analysis uses the seasonal indicator from Trade Navigator and uses data going back to 1984.
- The weekly chart shows that prices are currently trading the weekly downtrend, line b, that connects the 2012 highs.
- The longer-term downtrend (line a) is now just below the $106 level.
- There is long-term support, line c, at $78.80 with the 2012 low at $77.24.
The daily chart of the March 2013 crude oil contract shows that the resistance at $95.20, line d, has now been reached.
- There is additional chart resistance in the $96-$98 area.
- The uptrend in January has been gradual after the resistance at $91.60 was overcome.
- The on-balance volume (OBV) broke through its 3 ½ month downtrend, line f, in December.
- The trend in the daily OBV is clearly positive and the weekly OBV (not shown) has overcome its early 2012 highs.
- There is initial support at $92.83 and the rising 20-day MA with further support now at $91.60 (line e).
NEXT PAGE: An Attractive Stock in an Attractive Sector |pagebreak|
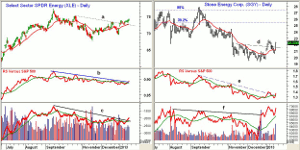
The daily chart of the Select Sector SPDR Energy (XLE) shows that the short-term resistance, line a, was overcome the second trading day of 2013.
- The next resistance is at $75.19, which was the October high.
- Additional resistance is in the $76.50-$77.35 area.
- The downtrend in the relative performance, line b, has just been broken.
- A strong move in the RS line above the December highs would complete the bottom and signal it is a market leading sector.
- The daily downtrend in the OBV, line c, has now been broken as the OBV is testing the December highs.
- There is minor support now at $73-$73.40 area with the quarterly pivot at $71.99.
- Major support at the December 31 low of $69.57.
Stone Energy Corp. (SGY) is a $1.07 billion independent oil and gas company that traded as high as $35.47 in February 2012.
- The resistance at $21.67, line d, was overcome at the start of 2013.
- SGY dropped back below this level and the 20-day EMA earlier this week before closing strong yesterday and above the quarterly pivot at $21.97.
- There is next resistance at $23-$23.50 with the 38.2% Fibonacci retracement resistance at $25.45.
- The daily relative performance appears to be completing its bottom as it has turned higher after breaking its downtrend, line e.
- The daily OBV broke through four-month resistance, line f, just before Christmas as it was leading prices higher.
- Volume was strong Wednesday and the OBV has now turned up from its rising WMA.
What it Means: As I have mentioned many times in the past, I just started looking more closely at seasonal patterns a few years ago as John Person shared his very impressive research. He uses his many years of experience to draw his own seasonal conclusions, which can be found in the 2012 Commodity Trader’s Almanac. He writes “Crude oil has a tendency to bottom in mid-February and then rally through mid-May. It is that early February break that can give traders an edge by buying low in a seasonally strong period.”
Of course, the technical studies have to agree with the seasonal before it is time to act. The lack of any impulsive action in the energy ETFs has kept me on the sidelines, but there are several oil stocks in the model portfolio.
Though I like composition of the SPDR S&P Oil and Gas Exploration ETF (XOP) better than Select Sector SPDR Energy (XLE), it does not currently look as positive. I would wait for a setback to buy either, but Stone Energy Corp. (SGY) looks attractive now.
How to Profit: For Stone Energy Corp. (SGY), go 50% long at $21.92 and 50% long at $21.32, with a stop at $20.18 (risk of approx. 6.6%) (Tweeted before the open).
For Select Sector SPDR Energy (XLE), go 50% long at $72.94 and 50% long at $72.12, with a stop at $68.89 (risk of approx. 5%).
For SPDR S&P Oil and Gas Exploration ETF (XOP) go 50% long at $55.44 and 50% long at $54.56, with a stop at $51.83 (risk of approx. 5.7%).


