This week’s earnings reports will be the next big test for the stock market and the focus is likely to be on the big banks, but Moneyshow’s Tom Aspray sees opportunities in those banks that drop if earnings disappoint.
The US stock index futures are a bit lower early Monday as they do not seem to be impressed by the 3% gain in the Shanghai Composite. Of course, the real test is likely to come from home as the market reacts to this week’s full slate of earnings reports.
Since the November, lows the Select Sector SPDR Financial (XLF) has been one of the star performers as it is up 13.6% versus just a 9.2% gain in the Spyder Trust (SPY). Both look positive technically though the financials stocks will be under the microscope this week.
Often times a close analysis of the technical studies will help warn one in advance of a stocks earning’s misses, but it can also help you spot which stocks to buy if they correct in reaction to their earnings. Two of the big banks that report earnings this week are outperforming the S&P 500 and look attractive for purchase at good support.
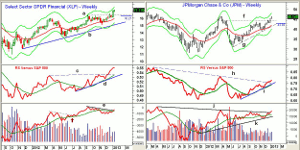
Chart Analysis: The weekly chart of the Select Sector SPDR Financial (XLF) shows the strong close above the resistance at line a, to start off the New Year.
- The initial upside targets are in the $18 area with the quarterly R2 at $18.42.
- There are further chart targets in the $19-$20 area.
- The weekly relative performance also shows an impressive breakout through resistance at line c, which confirms the price action.
- The weekly on-balance volume (OBV) has broken through its short-term downtrend, line e, that was formed last fall.
- A similar OBV breakout last July was a good buy signal and XLF rallied over 17%.
- There is initial support now at $16.45-75 with the quarterly pivot at $16.23.
JPMorgan Chase & Co. (JPM) will report their earnings Wednesday and JPM has had a nice run from the late 2012 lows at $42.90 breaking out above resistance at $44.24, line f.
- The next resistance is at the 2012 high at $46.29 with the early 2011 high at $48.36.
- The relative performance broke through its longer-term downtrend, line h, which confirms the uptrend in the RS line (line i).
- The RS line has held well above its rising WMA.
- The weekly OBV moved through its long-term resistance, line j, in 2013 as it is acting strong than prices.
- The daily studies are positive and have confirmed the recent highs.
- There is initial support at $44-$44.50 with the quarterly pivot at $42.83.
NEXT PAGE: Two More Big Banks
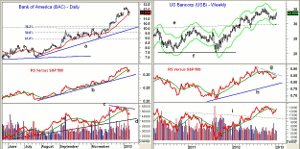
|pagebreak|Bank of America (BAC) closed lower last week on over one billion shares. The close was just above the 20-day EMA at $11.43 with the quarter pivot at $11.06.
- There is further support in the $10.50-$10.70 area with the 38.2% Fibonacci support from the July lows at $10.16.
- The former long-term support (now resistance) and the long-term uptrend, line a, are in the $10 area.
- The daily relative performance is still well above its uptrend, line b, but is now below its WMA.
- The weekly RS line (not shown) did confirm the highs, but has now turned lower. It is well above its rising WMA.
- The daily OBV did form a negative divergence, line c, at the recent highs before dropping below its WMA.
- The OBV is still above its more important support at line d.
- There is initial resistance at $12-$12.20 with the quarterly R1 resistance at $13.16.
US Bancorp (USB) also reports on Wednesday and it closed with nice gains last week and above the quarterly pivot at $33.05.
- USB broke out of a seven week trading range in the first week of 2013.
- The weekly starc+ band is at $34.67 with the quarter R1 resistance at $35.14.
- In October, USB had a high of $35.46.
- The weekly relative performance has turned up, but is still below its downtrend, line g, and it’s WMA.
- The weekly OBV broke through major resistance, line i, in the middle of June.
- The OBV did confirm the recent highs and has moved back above its WMA.
- The daily studies (not shown) appear to have just completed their bottom formations.
- There is initial support now in the $33.05 to $32.60 area and then at $31.40-$31.70.
What it Means: Since last July, the Select Sector SPDR Financial (XLF) has been one of my favorite sectors, and I recommended adding to positions in December. Though it may consolidate or correct over the next week or so, there are no signs yet of a top.
The weekly studies on JPMorgan Chase & Co. (JPM) are quite strong, and I would look to buy if it does correct.
The negative daily studies on Bank of America (BAC) suggest it may correct further before the longer-term uptrend resumes. For now, I would only buy at much stronger support.
US Bancorp (USB) has been lagging both BAC and JPM, but I would stay with previously recommended long positions.
How to Profit: For JPMorgan Chase & Co. (JPM), go 50% long at $44.78 and 50% long at $43.59, with a stop at $42.44 (risk of approx. 3.9%).
For Bank of America (BAC), go 50% long at $11.04 and 50% long at $10.48, with a stop at $9.94 (risk of approx. 7.6%).
Portfolio Update: You should be long US Bancorp (USB) at $31.94, with a stop at $30.83. You should also be long the Select Sector SPDR Financial (XLF) from $14.36 and $15.94, with a stop at $15.66.


