Though the stock market fell victim to the Grinch during the shortened holiday trading, MoneyShow’s Tom Aspray does some after-Christmas shopping for stocks that could look attractive in the new year.
Stocks drifted lower Monday but are trying to bounce in Wednesday’s early trading. The short-term technical readings suggest more choppy action is likely over the near term before a last minute, temporary fix is passed.
The failure to pass a quick fix could cause a sharper correction in early 2013. The intermediate technical readings and improvement on the economic front do favor higher prices in the 1st quarter of 2013. I do expect the major average like the S&P 500 or Spyder Trust (SPY) to gain double digits during 2013.
Of course, from a seasonal standpoint stocks are typically strong into the middle of the year, and I would expect to see more signs in the first quarter that the economy is actually getting stronger. That is one of the reasons I have been recommending that the current weakness be used to stuff your stockings with stocks.
The energy sector typically has its strongest seasonal period from early February through June and it has been one of the weakest sectors so far in 2012. While there are no clear signs yet that the energy sector has bottomed there are bullish signs from the crude oil market suggesting a low is in place. The longer-term analysis of these two oil stocks indicates that a pull back to support will be a good buying opportunity.
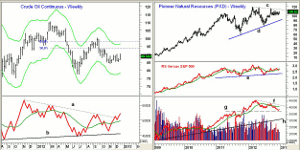
Chart Analysis: The weekly chart of crude oil shows a fairly tight range over the past eight weeks with support at $84.05-$85.25.
- There is initial resistance at $90.54 with the 50% Fibonacci retracement resistance at $94.
- This is calculated from the March high at $110.55 and the 61.8% retracement resistance is at $98.
- The weekly on-balance volume (OBV) moved back above its WMA in the middle of November.
- The break of the downtrend, line a, has now been confirmed, which is bullish for the intermediate term.
- There is initial support now at $87.60 with the 1st quarters pivot for the March contract at $88.30.
Pioneer Natural Resources (PXD) is a $13.2 billion independent oil and gas company that operates in the US and in South Africa.
- The weekly chart shows a very tight trading range as it dropped to test quarterly pivot support at $100.59 in early December. The October low was $99.75
- The chart appears to show a continuation or flag formation, lines c and d.
- The weekly relative performance has moved back above its WMA and did confirm the early 2012 all-time highs at $119.19.
- The weekly OBV also confirmed the highs before its correction.
- The decline in the OBV has now reached support at line g that goes back to the July 2011 highs.
- The OBV needs to move back above its WMA and resistance (line f) to confirm that the correction is over.
- The 127.2% Fibonacci target is at $131.38 with targets from the flag formation in the $150-$152 area.
NEXT PAGE: Promising Stock with Juicy Yield |pagebreak|
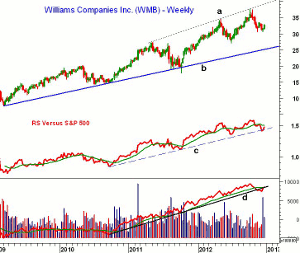
Williams Companies Inc. (WMB) is a $20.4 billion oil and gas pipeline operator that yields 4%. WMB peaked at $37.56 in October and is currently down 13.4% from the highs.
- The correction has so far held well above the 38.2% Fibonacci support from the 2011 lows at $30.
- There is short-term support now at $31.70 and the December low was $30.59.
- The relative performance did confirm the October highs and turned up last week.
- A move in the RS line above its WMA should signal that the correction is over.
- The daily RS line (not shown) is back above its WMA, which is a positive sign.
- The weekly OBV violated its uptrend in November but has now regained its uptrend and is testing its WMA.
- There is first resistance now at $33.30 and then at $35.40.
- The upper trend line on the weekly chart, line a, and is now in the $40 area.
What it Means: Though the energy sector does not have the long-term bullish outlook from the monthly charts like health care, there are some early signs that it could become a market leading sector during early 2013.
Currently there are two energy stocks in the “Charts in Play Portfolio” and now, I think, is a good time to start adding positions to this sector as the Select Sector SPDR Energy (XLE) has only had two down years since 2002. With its 4% yield, the Williams Companies Inc. (WMB) looks the most promising.
How to Profit: For Williams Companies Inc. (WMB), go 50% long at $32.10 and 50% long at $31.52, with a stop at $29.89 (risk of approx. 6.1%).
For Pioneer Natural Resources (PXD), go 50% long at $105.54 and 50% long at $103.88, with a stop at $99.34 (risk of approx. 5.1%).


