The industrial sector led the market higher last week and Moneyshow’s Tom Aspray has found two stocks in this sector that have completed major bottom formations making them likely market leaders in 2013.
Stocks managed minor gains Monday, and while the market internals were positive, they were not impressive. The NYSE Advance/Decline has continued to improve and is now very close to making new highs. A strong move to new highs in the A/D line would signal a much sharper rally.
Stocks are higher early Tuesday as the S&P futures are close to the key resistance at the December 3 highs. A strong close above these highs would set the stage for a test of the year’s high at 1474.51 in the S&P 500 or $148.11 in the Spyder Trust (SPY). The beaten down PowerShares QQQ Trust (QQQ), which tracks the Nasdaq 100, is unlikely to come close to its September high of $70.58.
In yesterday’s column, Best Sector Bets for the New Year, I discussed the four sectors that were outperforming the S&P 500 and looked the strongest technically. The industrials sector as represented by the Select Sector SPDR Industrials (XLI) became a market leading sector last week.
One market leading group that is part of the industrial sector is the S&P Construction & Engineering Index. It was up 1.6% Monday versus a small 0.2% gain in the SPY. Two stocks in this group appear to have completed long-term bottom formations, which gives them excellent upside potential.
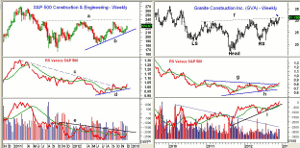
Chart Analysis: The weekly chart of the S&P Construction & Engineering Index tested the support in the 207 area in mid-November and closed strong last week.
- There is next resistance at the September high of 235.
- A close above the major resistance at 240, line a, will complete a major bottom with the first target at 260, which was the early 2011 high.
- This industry group index had a high of 430 in 2008.
- The relative performance broke through its downtrend, line c, in September before pulling back to support.
- The RS line shows a positive uptrend, line d, and a move above the September high will confirm the major bottom.
- The weekly OBV has moved back above its WMA but is still below major resistance at line e.
- The daily technical studies (not shown) look very positive as it was up sharply on Monday
Granite Construction Inc. (GVA) is a $1.22 billion heavy construction company that provides civil contracting and provides construction materials. It has a current yield of 2.3%.
- The weekly chart shows that it closed last Friday just above resistance at line f.
- This completes a long-term reverse head and shoulder bottom formation as the LS (left shoulder) was formed in the middle of 2010.
- The upside target from this formation is in the $44-$46 area.
- The RS line closed last week above resistance at line g, and the move above the early 2012 high completes a major bottom.
- The weekly OBV has been very strong as indicated by its uptrend, line i. It closed last week at three year highs.
- The volume pattern (blue line) is consistent with the chart formation as volume peaked as the LS was being formed and has since formed lower highs.
- There is first support at $30.30-$30.80 and then in the $29.50 area. Stops on new longs should be under the late November low at $28.65.
NEXT PAGE: Another Stock Showing Bullish Action
|pagebreak|Foster Wheeler AG (FWLT) is a $2.52 billion dollar heavy construction company that is based in Switzerland. Recent data shows that they have $709 million in cash with only $152 million in debt. The chart formation for FWLT could also be called a reverse H&S, but it is not as clear.
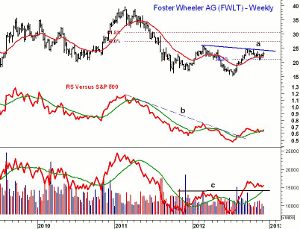
- FWLT dropped below the 20-week EMA and the 38.2% Fibonacci support in November as it had a low of $20.88.
- There is year-long resistance, line a, at $24.41-$24.73. A move above this level should signal a rally to the 50% Fibonacci retracement resistance at $27.51.
- This resistance is calculated from the 2011 high at $39.75, but in early 2008 FWLT had a high of $85.65.
- The relative performance broke its weekly downtrend, line b, in August and has now turned up from its WMA.
- The weekly on-balance volume (OBV) looks much stronger as it moved above key resistance at line c, in September.
- This completed a major bottom formation and the OBV held well above its WMA on the recent correction.
- There is first support at $23 with stronger in the $22.00-$22.40 area.
What it Means: The positive weekly analysis of the industrial sector and the bullish action of construction & engineering industry group suggests that they could be market leaders well into 2013.
These two stocks also appear to have completed significant bottom formations, but I would be a patient, smart buyer and wait for a pullback to buy.
How to Profit: For Granite Construction Inc. (GVA), go 50% long at $30.44 and 50% long at $30.06, with a stop at $28.43 (risk of approx. 6%).
For Foster Wheeler AG (FWLT), go 50% long at $22.92 and 50% long at $22.46, with a stop at $21.44 (risk of approx. 5.5%).


