Against the backdrop of a better-than-expected Non-Farm Payroll report this morning, MoneyShow’s Tom Aspray conducts a review of the Charts in Play portfolio, with updated recommendations.
The mid-week decline in the stock market to near-term support was well supported, which is a positive sign. Stocks got a pleasant surprise this morning as the just released jobs report was much better than expected. The stock index futures are showing nice gains. A sharply higher close today with very strong A/D numbers should push the A/D line to new mutli-year highs.
The major averages still need to close above the early December highs to reinforce the positive momentum. The market has clearly relieved the oversold readings from the middle of November when just 20% of the Nasdaq 100 stocks were above their 50-day MAs. Now over 60% are above their MA and the September peak was near at 80%.
The overseas markets continue to act the best as they have since early last month. Some of the sectors I have recommended are doing well, but others are showing more signs of weakness than I would like, so a change in strategy and stops is therefore needed.
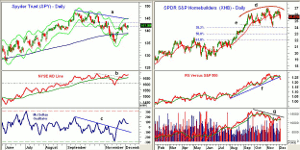
Chart Analysis: The Spyder Trust (SPY) tested the 61.8% Fibonacci retracement at $142.99 on Monday as the high was $142.92.
- A strong close above this level should signal a rally to the downtrend, line a, and the daily starc+ bands at $144.60-$144.80.
- The weekly starc+ band (not shown) is now at $147.80.
- The daily NYSE Advance/Decline line has broken its downtrend, line a, but it has yet moved above the October highs.
- The weekly A/D line (not shown) turned higher three weeks ago and is likely to improve further this week.
- The McClellan Oscillator broke through its downtrend, line c, on November 20 and is holding above the zero line.
- There is first support now at $140.37 and then in the $139.70 area.
- The 200-day MA and daily starc- band are now at $138.70.
The SPDR Homebuilders (XHB) has reversed over the past four days after peaking at $26.84. The homebuilders typically form a secondary seasonal low in late November and then rally into the April-May time frame.
- Though the monthly analysis is clearly positive for XHB the daily chart shows a potential topping formation, line d.
- One can make a case for an H&S top with the neckline (line e) now in the $24 area.
- This also corresponds to the 38.2% Fibonacci retracement support with the 50% level just under $23.
- The daily uptrend in the relative performance or RS analysis, line f, has just been broken but it did confirm the recent highs.
- The daily OBV did not confirm the price high and has formed lower highs, line g. Volume has picked up as XHB has declined.
- The weekly OBV (not shown) is well below its WMA and has broken its uptrend.
- There is initial resistance now at $26-$26.40 and then in the $27 area.
Next PAGE: Update on Three Portfolio Stocks |pagebreak|
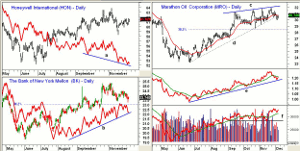
Honeywell International Inc. (HON) is still in a slight uptrend with near term resistance at $62
- The daily on-balance volume (OBV) has been diverging from prices, line a, despite the positive monthly OBV (not shown)
- This increases the chances of a drop back towards more important support before the long term uptrend resumes.
- Initial support at $60.24 and then at $59.85.
The Bank of New York Mellon (BK) was inadvertently left off the last portfolio review. BK had a high at $25.35 before reversing and made a mid-November low of $23.39.
- This low was broken Wednesday though BK close almost flat for the day.
- The 38.2% support is at $23.04 and the stop should be raised to just under this level.
- The OBV has formed higher highs and higher lows, line b, which is positive.
- A close above the resistance at $24.50 would be positive.
Marathon Oil Corporation (MRO) peaked at $31.93 on November 23 and tested resistance, line c, before the recent pullback.
- The daily uptrend, line e, was broken this week as the $30 level was tested.
- There is next support at $29.23-$29.41 with the 38.2% Fibonacci retracement support at $28.57
- The relative performance or RS analysis is now testing its uptrend, line f, but it did confirm the recent highs.
- The daily OBV broke out to new highs last month after forming a nice base.
- It has again turned up from its WMA. The weekly OBV (not shown) has not yet broken out to the upside.
- On a breakout to new highs the next major resistance is at $35.40.
What it Means: Despite the positive early tone for stocks today, I do not like the short-term action in the homebuilder ETF or the individual home building stocks. Therefore I will cancel orders from November 27 to buy the individual home building stock and watch for a better entry level.
I have also adjusted the strategy for Honeywell International Inc. (HON) and Bank of New York Mellon (BK).
How to Profit: I am also watching the iShares PHLX SOX Semiconductor ETF (SOXX) and may send out a new buy recommendation by Twitter.
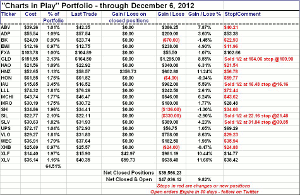
Portfolio Update; For SPDR S&P Homebuilders (XHB), you should be 50% long at $25.64. Cancel second buy order and use a stop now at $24.88.
For Honeywell International Inc. (HON), you should be long from $61.55; use a stop at $59.77.
For Bank of New York Mellon (BK), you should be long from $24.09; use a stop at $22.93.
For Marathon Oil Corporation (MRO), you should be long from $30.19; keep the stop at $28.48 for now.
NEXT PAGE: The Charts in Play Portfolio |pagebreak|


