The gains in the US market were the best Monday in over two months, but technically some of the global markets are acting even better. MoneyShow’s Tom Aspray sees some interesting opportunities in two out-of-favor Euro markets.
Last Friday’s rebound lacked real power, but Monday’s surge in the global stock markets was impressive even in the US, which has borne the brunt of the selling over the past two months.
The rally has helped to relieve the US market's short-term oversold status, but a bottom does not yet look complete. The S&P 500 has strong resistance in the 1,395 to 1,405 area, and needs a close above 1,435 to signal that the worst of the selling is over.
So who has been leading the rebound? The technical picture for some of the overseas markets looks much better as some of the best performers Monday were a couple of unloved Euro markets that beat the S&P 500.
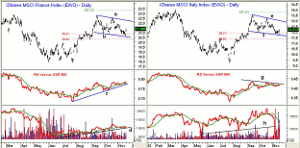
The iShares MSCI Italy Index (EWI) was up 3.3% and iShares MSCI France Index (EWQ) gained 2.9%. The daily charts of these two ETFs show typical continuation patterns that suggest the worst of the selling may actually be over. Moody’s slight downgrade of France’s debt on Monday has been mostly factored in, I feel, and it may provide a better entry level.
The Chinese market was also strong, and two China ETFs that I recently discussed also outperformed the Spyder Trust (SPY) on Monday.
These overseas markets continue to warrant a closer look, as they may be some of the market leaders as the global stock markets try to rally into the end of the year.
Chart Analysis: The iShares MSCI France Index (EWQ) has 50% in its Top Ten holdings, a yield of 3.2%, and an expense ratio of 0.52%. The daily chart shows that EWQ rallied from the July low at $17.83 to a high of $22.76 in September.
- The correction from the highs shows a typical flag formation (lines a and b).
- The 38.2% Fibonacci support at $20.86 was violated last Friday, with the more important 50% support at $20.27.
- The daily relative performance or RS analysis has formed a solid uptrend from the July lows (line c), and is again trying to turn higher.
- The OBV is in a shallower uptrend (line d), but still looks positive.
- The weekly OBV (not shown) is still below its WMA.
- The flag formation will be completed on a close above $22.35, with the 127.2% Fibonacci target at $22.32.
- From the width of the flag formation, one can project a move to the $24 area.
The iShares MSCI Italy Index (EWI) is even less diversified than EWQ, as it has over 70% in its Top Ten holdings. It has a higher yield of 3.3% and an expense ratio of 0.51%.
- The daily chart looks very familiar, as it appears to have bounced from the lower boundary of its flag formation (lines e and f).
- The 38.2% Fibonacci support at $11.88 was just slightly violated last week, with the 50% retracement support at $11.37.
- The daily and weekly relative performance appears to have completed their bottom formations during the summer. The daily RS line is in a tight range, and a move above resistance (line g) would be a good sign.
- The on-balance volume (OBV) dropped sharply in early November, as there were two days of heavy selling. Volume was strong Monday, suggesting that the worst of the selling is over.
- There is next resistance at $12.73, and a close above $13.25 would complete the continuation pattern. The 127.2% Fibonacci retracement target is at $13.60, with the measured target from the flag formation at $14.65.
NEXT: A Look at China ETFs
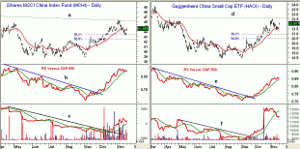
|pagebreak|The iShares MSCI China Index Fund (MCHI) dropped slightly below the 38.2% Fibonacci retracement support at $43.43 as last Friday’s low was $43.24
- The 50% retracement support is at $42.54, with additional chart support a bit lower at $42.40.
- The daily relative performance broke its downtrend (line b) at the end of September, and continues to looks strong.
- The daily on-balance volume (OBV) moved through its resistance (line c) in October, and has held above its WMA on the recent correction.
- Next resistance stands at $45.50, and then $46.20 (line a). The weekly Starc- band is at $46.43.
The Guggenheim China Small Cap ETF (HAO) has been acting stronger than MCHI, as it has been holding its 20-day EMA, with its recent low at $21.35.
- The 38.2% retracement support is at $20.83, with the 50% Fibonacci retracement support at $20.45.
- The daily relative performance has held above its WMA on the recent setback, after breaking its downtrend (line e) in September.
- The daily OBV has dropped back below its WMA after breaking its downtrend (line f) in September.
- There is next resistance at $22.55, and then longer-term resistance in the $24 area.
What it Means: Just after the election, there were signs that the overseas markets were looking better than those in the US. The continuation patterns for both EWQ and EWI suggests that the worst of the selling in these two ETFs is over.
On new longs, the stops need to be under the 50% support level, so the best entry would be on a minor pullback. (For more on stop placement, read my recent Trading Lesson.)
It has not been confirmed yet that the correction in the Chinese ETFs is over. Therefore, on existing longs, raise the stops to protect against a more complex correction.
How to Profit: For iShares MSCI France Index (EWQ), go 50% long at $21.24 and 50% long at $20.92, with a stop at $19.92 (risk of approx. 5.4%).
For iShares MSCI Italy Index (EWI), go 50% long at $12.13 and 50% long at $11.96, with a stop at $11.26 (risk of approx. 6.5%).
Portfolio Update: For iShares MSCI China Index Fund (MCHI), investors should be 50% long at $43.92 and 50% long at $43.46. Use a stop now at $42.36.
For the Guggenheim China Small Cap ETF (HAO), investors should be 50% long at $21.52, as the second buy level at $21.16 was not hit. Cancel this order. Use a stop now at $20.64.
Longs in the Vanguard Emerging Markets (VWO) established at $41.52 to $41.20 were stopped out at $40.24, as the low was $40.19. I will keep watching this one for a new entry level once there is stronger evidence that the correction is over.
- For Tom’s analysis of the Japanese stock market, see “Will Hedge Funds Be Wrong Again?”


