With the election over, investors turned their worries towards the fiscal cliff, the ailing European economies, and turmoil in the Middle East, hence the slide in the stock market; but two stocks avoided the downtrend, says MoneyShow’s Tom Aspray.
Stocks continued to drift lower on Thursday adding to the losses since Election Day as the Spyder Trust (SPY) is down 5% in just seven trading days. Market internals are now starting to flash oversold readings as the McClellan oscillator is now at -279. During the correction in May the oscillator had a low of -335.
All the sectors have been hit hard also during the same period with many weaker than SPY. The Sector Select SPDR Financial (XLF) has lost 6%, the Sector Select SPDR Technology (XLK) has lost 5.5% while the Sector Select SPDR Energy (XLE) is down 5.3%.
Despite the steepness of the recent slide and the carnage in the tech sector the technical evidence does not indicate that the stocks have completed a major top. The ongoing debate over the fiscal cliff and the threat of increased conflict in the Gaza Strip are likely to add further pressure on stocks over the near term.
Once the market decline is over those sectors and stocks that have outperformed the S&P 500 or Spyder Trust (SPY) are likely to lead the next market rally. Just over a week ago, I focused on oil stocks and the energy sector.
The weaker performance of the Sector Select SPDR Energy (XLE) was due in part to its 35% stake in Exxon Mobil (XOM) and Chevron Corp (CVX), which are down 6.7% and 10.9% respectively this month. Two of the oil stocks I discussed have been bucking the market’s downward trend and if this continues they are likely to be two of the next market leaders.
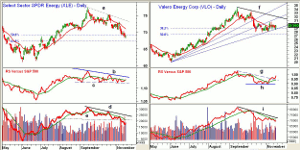
Chart Analysis: The daily chart of the Sector Select SPDR Energy (XLE) has closed this week below the 50% Fibonacci support at $69.19, which turns the focus on the 61.8% support at $67.26.
- The weekly uptrend that connects the 2011 and 2012 lows is at $65.60.
- The relative performance or RS Analysis has stayed in a narrow range, line c, indicating that XLE is matching the action in the S&P 500.
- A move above the long-term downtrend, line b, is needed to signal that XLE is outperforming the S&P.
- The daily OBV dropped sharply at the end of last week as the support at line e, was violated.
- The OBV is now well below its downtrend, line d, and its declining WMA (weighted moving average).
- There is initial resistance now at $69.50-$70.20 with much stronger at $72.
Valero Energy Corp. (VLO) has been holding the 61.8% Fibonacci fan line during November and it closed strong Thursday. It is actually up slightly in November and yields 2.4%.
- A daily close above the resistance at $30.70 is needed to signal that the correction is indeed over.
- The daily downtrend, line f, and further resistance is in the $32-$32.40 area.
- The 127.2% Fibonacci target from the recent correction is at $36.15.
- There is support from the October lows now at $27.89-$28 with the 50% support at $27.12.
- The RS line has moved through its downtrend, line g, indicating that it is outperforming the S&P 500.
- The OBV is still below its resistance at line i and its WMA.
- The weekly OBV (not shown) is still holding well above its WMA.
NEXT PAGE: Another Oil Stock Bucking the Trend
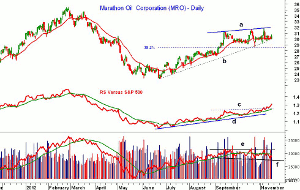
|pagebreak|Marathon Oil Corporation (MRO) has also higher Thursday and has chart resistance now in the $31.60-$32 area, line 1.The trading range since August does look like a continuation pattern.
- The daily uptrend is at $29.52 with initial chart support at $29.23.
- There is weekly support at $28.63, which was the late October low.
- The 38.2% Fibonacci retracement support is at $28.60 with the 50% support at $27.48.
- The relative performance has been in a solid uptrend, line d, since the June lows and has broken through resistance at line c.
- The daily on-balance volume (OBV) is still locked in a trading range, lines e and f. A breakout would be bullish.
- The weekly OBV (not shown) is above its WMA and does appear to have bottomed.
- On a breakout above $32 the next major upside targets are in the $34.65 to $35.49 area.
What it Means: The technical outlook right now does not favor buying the energy ETFs, but I still like these two stocks. On the first decent market rebound, it will be important that these two stocks continue to perform well.
Given the daily downtrend in the overall market, fairly tight stops are recommended on these two oil stocks. As I discussed in this week’s trading lesson, stop place and stop management are a key factor in investment success. If my stops are hit, it does not mean that these two stocks will not be future market leaders, and I will keep them on my radar.
How to Profit: Should already be long both Valero Energy Corp. (VLO) and Marathon Oil Corporation (MRO) and still like them at the levels indicated below.
Portfolio Update; Should be 50% long Valero Energy Corp. (VLO) at $29.68 and 50% long at $29.14 with a stop at $27.68. This stop is just under the October lows.
Should be 50% long Marathon Oil Corporation (MRO) at $30.88 and 50% long at $29.84 with a stop at $28.48. This stop is just under the 38.2% support level.
The 50% long position in Select Sector SPDR Energy (XLE) from $72.26 and 50% long at $71.72 or better were stopped out at $69.87
The 50% long position in Hess Corp. (HES) from at $54.42 and 50% long at $53.66 were stopped out at $51.28 and HES traded as low as $48.38 on Thursday.


