Stock index futures dropped back towards last week’s lows in early trading suggesting that the selling is not yet over. Last Wednesday’s sharp down day does favor an oversold bounce this week but it would take several consecutive strong positive closes to stabilize the short term outlook, according to MoneyShow’s Tom Aspray.
Even the high flying China ETFs are correcting from their October highs as the evidence continues to indicate that the Chinese economy is indeed bottoming. As I noted last week many of the global markets are acting better than the US market. This suggests that in 2013 some of the non-US equity markets may offer a better return.
Since the start of October, the iShares MSCI China Index Fund (MCHI) is up 6.5% compared to a 4% drop in the Spyder Trust (SPY). That is a spread of over 10% in just six weeks.
According to the Chinese calendar this is the Year of the Water Dragon, which historically is a bullish year for stocks. It lasts until February of 2013 and by then the bottom in the Chinese economy should be confirmed.
These two China focused ETFs offer different ways to participate in the anticipated recovery and one emerging market ETF can provide exposure in China as well as other emerging markets.
Chart Analysis: Though the iShares Trust FTSE China 25 Index Fund (FXI) is considered by most to be the favored China play, there are several reasons that I prefer the iShares MSCI China Index Fund (MCHI).
- Even though MCHI also has a high concentration in financials (35% versus 53% in FXI) it is more diversified as it has a basket of 144 stocks as opposed to just 25 in FXI.
- Both have over 10% in China Mobile (CHL) but MCHI has an expense ratio of 58 points versus 72 points for FXI.
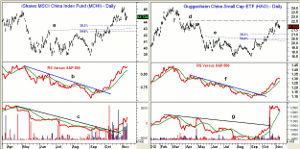
- The daily chart shows that the 38.2% Fibonacci retracement support is at $43.43 with former resistance support in the $43 area, line a.
- The 50% retracement support is at $42.54 with important chart support in the $41 area.
- The relative performance or RS analysis broke its downtrend in late September, line b, and by early October had clearly completed a bottom.
- The weekly RS analysis (not shown) also indicates it is stronger that the S&P 500.
- The volume surged in October as the daily OBV broke its downtrend, line c, and still looks very strong.
- There is first resistance now in the $45-$45.50 area.
The Guggenheim China Small Cap ETF (HAO) is a smaller ETF ($215 million) that has 225 stocks in its portfolio. Only stocks with under $1.56 billion in capitalization are included and only 13% is concentrated in the top ten holdings.
- The ETF has an expense ratio of 70 basis points and averages 135K shares per day.
- The chart shows that HAO has pulled back slightly from its high at $22.50, line d.
- There is first support now at $21.30-$21.50 with the 38.2% retracement support currently at $20.83.
- The 50% Fibonacci retracement support is at $20.45 with the breakout level at $20.30, line e.
- The relative performance broke through its downtrend, line f, at the end of September and led prices higher.
- The RS line continues to rise strongly and the weekly analysis is also positive.
- The OBV broke through its resistance, line g, in the middle of October.
- Once above $22.50 the next upside target is in the $24 area.
NEXT PAGE: A Low-Cost Way to Play China
|pagebreak|The Vanguard MSCI Emerging Markets (VWO) has about 19% invested in China with over 60% overall in Asia, 18% in greater Europe, and 21% in Latin America. It has assets of over $71 billion and in early October stopped tracking the MSCI Emerging Market index and started following the FTSE Emerging Market Index. The main change is that South Korea is no longer included.
- It has an expense ratio of only 20 basis points and currently yields 3.4%.
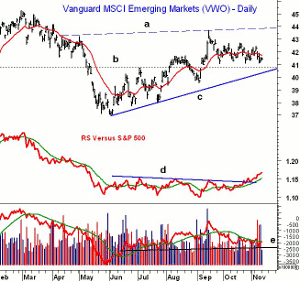
- The daily chart shows that VWO has traded between $41.06 and $42.70 since late September.
- There is converging support in the $40.70 to $40.30 area, lines b and c.
- The relative performance completed its bottom formation in October as resistance at line d was overcome.
- The daily on-balance volume (OBV) surged in September but has since pulled back to support at line e and is currently below its WMA.
- On a move above the near-term resistance at $42.50, the next targets are in the $43.80 to $44 area.
- In February 2012 VWO had a high of $45.27.
What it Means: The benefits of diversifying overseas really come to the forefront when the market is getting hit hard, as it was last week over more domestic concerns or fears. As I discussed last week “Don't Jump Off the Fiscal Cliff” selling should be part of a predetermined plan (your stops) not caused by fear of a tax increase.
A deeper correction in these two China ETFs should be a buying opportunity but it is possible that more important support will not be tested before the uptrend resumes.
Vanguard MSCI Emerging Markets (VWO) is now trading below where I previously recommended it, but its strong relative performance analysis indicates it is still a good buy.
How to Profit: For iShares MSCI China Index Fund (MCHI), go 50% long at $43.92 and 50% long at $43.46 with a stop at $40.72 (risk of approx. 6.8%).
For the Guggenheim China Small Cap ETF (HAO), go 50% long at $21.52 and 50% long at $21.16 with a stop at $19.83 (risk of approx. 7.1%).
Those not long Vanguard Emerging Markets (VWO) should buy at $41.52 to $41.20 with a stop at $40.24.
NEXT PAGE: Porfolio Update
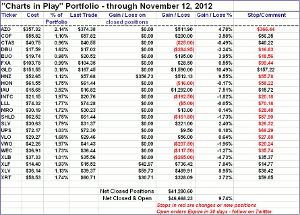
|pagebreak|Portfolio Update: Should be 50% long the Vanguard Emerging Markets (VWO) $42.36 and 50% long at $42.08, with a stop for now at $40.24.


