Relief over the US election result was short-lived as investors turned their attention to the fiscal cliff. However, MoneyShow’s Tom Aspray highlights some picks in the energy patch that could be flashing buy signals.
The close in the stock market Tuesday was surprisingly strong and while the major averages are still locked in their recent trading ranges there were some industry groups that appear to have completed their corrections.
It has been a wild ride overnight in the stock index futures as they sold off in early reaction to the Obama victory, but by 3:30 am had rallied back above Tuesday’s highs. The sellers then again took over as the S&P futures are down over 12 points. It will take significantly more buying than we saw early this week to signal that the market’s overall correction is over.
The gold futures have been able to hold their early gains Wednesday which suggests that the correction in the precious metals may be over. A strong daily close on Wednesday is needed to support the bullish case. As I discussed last month, I still think that the recent correction is a buying opportunity.
There was also positive price action in many of the energy stocks and the increasing volume is a positive sign. One popular energy ETF and three energy stocks look attractive for new purchases on a slightly pullback as relatively tight stops can be used.
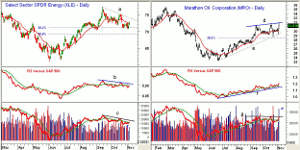
Chart Analysis: The Select Sector SPDR Energy (XLE) peaked in September at $77.35 and has tested the 38.2% Fibonacci support twice in the past two weeks. The Fibonacci retracement levels can be used to determine both entry and exit levels.
- Tuesday’s close above the 20-day EMA is a positive sign with further resistance at $74.14 and the downtrend, line a.
- A strong close above $75.20 should confirm that the correction is over.
- The 127.2% Fibonacci retracement target is at $79.16.
- The daily relative performance or RS analysis has closed back above its WMA, but a close above the resistance at line b is needed to confirm that the correction is over.
- Volume picked up Tuesday as the OBV is also above its WMA but below resistance at line d.
- The OBV formed a short-term positive divergence at last Friday’s lows (see arrow).
- There is minor support now at $71.80-$72.20 and then at $70.40-$70.80.
- The 50% retracement support level is at $69.19
Marathon Oil Corporation (MRO) moved above its previous two highs Tuesday, but has not yet closed above the resistance at line d.
- MRO has tested the daily uptrend, line e, twice in the past two weeks.
- The correction has held above the 38.2% Fibonacci retracement support at $28.37.
- The relative performance made new highs Tuesday as it held well above its WMA and the uptrend, line e, on the current correction.
- The weekly RS Analysis (not shown) is acting even stronger as it is well above its WMA.
- Volume was almost double the daily average Tuesday (see arrow) and the daily OBV is close to breaking out.
- There is first support at $30.40-$30.60 with further in the $29.50-80 area.
Next: A Look at Valero Energy Corp. and Hess Corp.
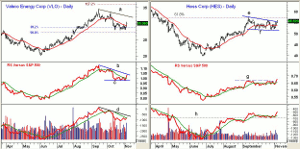
|pagebreak|Valero Energy Corp. (VLO) dropped below its 38.2% retracement support and basic Fibonacci analysis makes the 50% support at $27.19 the next major level to watch.
- VLO had a high of $34.35 in September, but Tuesday’s close above the 20-day EMA is the first sign that the worst of the selling may be over.
- The 127.2% Fibonacci retracement target is at $26.15.
- The daily relative performance appears to have formed a bottom (line c) and a move through resistance at line b, will confirm it.
- The volume in VLO also picked up Tuesday, and the OBV is back above its WMA.
- The OBV needs to surpass the downtrend at line d to confirm that the correction is over.
- There is first good support now in the $29.20-$29.60 area with key support at $27.89.
Hess Corp. (HES) has completed its flag formation (lines e and f) and looks ready to overcome the 61.8% Fibonacci retracement resistance at $57.33.
- The measured upside target from the formation is in the $60.50-$62 area.
- HES had a high in early 2012 of $67.86.
- The daily relative performance has broken through its resistance (line g) which confirms the price action.
- The daily on-balance volume (OBV) held good support, line h, over the past two months and has moved above the early September highs.
- The daily chart has initial support now in the $53.80-$54.20 area.
- There is more critical support now in the $51.60-$52 area.
What it Means: Even though the overall stock market may give up Tuesday’s gains in Wednesday’s session, this is likely to create a buying opportunity in those sectors that already appear to have bottomed. In October I made the case that the energy stocks could lead the next market rally. They need to rally further to support this view. It will be important that the recent lows hold, which makes the risk control quite good on new long positions.
How to Profit: For those not already long Select Sector SPDR Energy (XLE) should go 50% long at $72.26 and 50% long at $71.72 with a stop at $69.87 (risk of approx. 3%).
For Marathon Oil Corporation (MRO), go 50% long at $30.88 and 50% long at $29.84 with a stop at $28.48 (risk of approx. 6.1%).
For Valero Energy Corp. (VLO), go 50% long at $29.68 and 50% long at $29.14 with a stop at $27.68 (risk of approx. 5.8%).
For Hess Corp. (HES), go 50% long at $54.42 and 50% long at $53.66 with a stop at $51.28 (risk of approx. 5.1%).
Portfolio Update: Should be 50% long Select Sector SPDR Energy (XLE) at $73.08 and 50% long at $72.74. Use a stop at $69.87.
Investors were 50% long the SPDR S&P Oil & Gas Exploration (XOP) at $48.66 or may have bought later at $55.32. Both were stopped out at $51.34.
For Weatherford International (WFT), investors were 50% long at $12.88 and 50% long at $12.46 and were stopped out at $11.79.


