The technical data is pointing to a sustained rally that could take gold to all-time highs within the next few months. MoneyShow's Tom Aspray analyzes four top metals ETFs to find the best ones for near-term buying.
The early release of Google’s (GOOG) earnings smacked the Nasdaq-100, as the Powershares QQQ Trust (QQQ) lost over 1%. Overall, the broad market held up pretty well, though disappointing numbers from Microsoft (MSFT) and Chipotle Mexican Grill (CMG) after the close may add some additional selling pressure.
This does not change Thursday’s analysis (Bulls Will Charge Before Elections), where I concluded prices are likely to break out to the upside in the next week. But what does that mean for gold? The Spyder Gold Trust (GLD) is down over 3% from the October 4 highs.
Five days before the recent highs, I cautioned that the rampant increase in bullish sentiment had increased the risk of buying gold at current levels. The short-term sell signals a week ago indicated a further decline was likely, and that a better buying opportunity would come at lower levels
Now that gold and silver have corrected further, the technical outlook suggests that we should see an end to the correction in the next few weeks. So it is important to have a buying strategy in place.
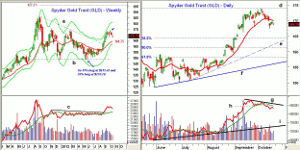
Chart Analysis: The weekly chart of the Spyder Gold Trust (GLD) shows the tight range in May and June that was followed by the completion of the triangle or flag formation (lines a and b) at the start of September.
- The weekly chart shows that the Starc+ band was tested in the middle of September and a doji (see arrow) formed at the recent highs. This was a sign of indecision.
- The first strong weekly support is at $164.75 and the 20-week EMA.
- The weekly OBV broke through its resistance (line c), confirming the price action
- The OBV is still well above its rising WMA.
- Once above the resistance at $174 to $175.46, the next strong resistance is in the $180 area.
- The 127.2% Fibonacci retracement target from the flag formation is at $197.50, with the measured target at $200.
The Spyder Gold Trust (GLD) has now dropped below its 20-day EMA, which is now declining.
- GLD made lower lows this week at $167.53, with next support in the $166 area.
- The 38.2% Fibonacci support is at $164.21, with the daily uptrend (line e) at $162.50. The 50% retracement support is at $161.17.
- The daily on-balance volume (OBV) formed a negative divergence at the recent highs (line g), which was confirmed by the break of support (line h) on October 10.
- The OBV has next good support at the late August highs.
- There is daily chart has resistance now at $171.34 to $171.95
Next: A Look at Silver's Potential
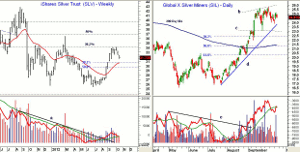
|pagebreak|The iShares Silver Trust (SLV) is tied to silver prices. It peaked at $34.08, which is the 38.2% Fibonacci retracement resistance from the August 2011 highs at $46.98.
- The 50% retracement resistance is at $36.20, and a weekly close above this level will be bullish.
- There is short-term support now at $31.52, with the 38.2% Fibonacci retracement support and 20-week EMA at $30.71.
- The 50% support is at $29.68, with additional chart support at $29.28.
- The weekly OBV moved through its WMA and overcame its downtrend (line a) in August.
- The OBV is now testing its WMA, which is rising slightly.
- The daily OBV (not shown) did not confirm the recent highs, and is now below its WMA.
- There is initial resistance now at $32.80 to $33.20.
The Global X Silver Miners (SIL) was one of the third quarter's top-performing ETFs, and is made up of 35 silver mining stocks.
- The daily chart shows a broad trading range (lines b and c) since the early September highs.
- There is support now at $23.60 to $23.90 and the uptrend (line d).
- Additional support at $23 (line c), with the 38.2% Fibonacci retracement support at $22.36.
- The now rising 200-day MA and the 50% retracement support are in the $21.30 area.
- The daily OBV completed a well-defined bottom in early September at the downtrend (line e).
- Volume was heavy on Tuesday as buyers stepped in. The OBV has just rebounded back to its flat WMA
- The weekly OBV (not shown) is holding up much better, as it is acting stronger than prices.
- There is strong resistance at $25.76, which was the recent high and also is the 61.8% Fibonacci retracement resistance from the 2011 highs at $31.34.
It is still my view that gold will move to new highs in 2013, if not sooner, with likely upside targets in the $2,000 to $2,200 area.
The outlook is similar for silver, and the Global X Silver Miners (SIL) is acting better than iShares Silver Trust (SLV). Both look attractive at lower levels. Silver has next upside targets in the $40 to $42.50 area.
How to Profit: For Global X Silver Miners (SIL), go 50% long at $23.04 and 50% long at $22.48, with a stop at $20.95 (risk of approx. 7.8%).
For the iShares Silver Trust (SLV), go 50% long at $30.90 and 50% long at $30.34, with a stop at $28.32 (risk of approx. 7.5%).
For those not already long GLD or IAU, go 50% long the iShares Gold Trust (IAU) at $16.56 and 50% long at $16.34, with a stop at $15.72 (risk of approx. 7.5%).
Portfolio Update: Investors should also be 50% long the SPDR Gold Trust (GLD) at $152.42 and 50% long at $150.28. Use a stop now at $157.22. Traders should sell 25% at $178.12 or better.
Investors should be long multiple positions in the iShares Gold Trust (IAU) from $15.68 to $15.42, with a stop at $15.72.


