The sharp rally in crude-oil prices Tuesday was in contrast to the recent bleak global economic forecasts. MoneyShow’s Tom Aspray explains why two energy ETFs look attractive now.
Stocks were hit hard Tuesday, and overseas markets are lower again early Wednesday.
The damage has been most severe in the Nasdaq-100, which is already down 4.7% from the highs. The Dow Jones Transportation average was also weak, as it continues to diverge from the Dow Industrials, which has been a concern since early September.
One bright spot Tuesday was the crude-oil market, which closed sharply higher on heavy volume. Over the past six weeks, the energy sector has been doing much better than oil prices, as crude is down 8.6% from its recent highs while the S&P 500 Energy Sector is just 3.6% below its high.
Despite the increasing concern about the global economy and the waning belief that China will recover, many of the basic materials stocks, including energy, are painting a more positive picture. Therefore, increased exposure to the energy sector is recommended, and there are two energy ETFs that should be considered.
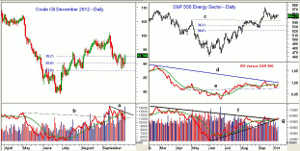
Chart Analysis: The daily chart of the December crude-oil contract shows that it dropped as low as $88.09 last week, but held above the 61.8% Fibonacci retracement support at $87.42.
- The next resistance is at $93.68 to $94.15, which if overcome on a closing basis would be positive.
- There is major resistance in the $96 to $98 area.
- The daily on-balance volume (OBV) is still below its short-term downtrend (line a), but did confirm the September highs.
- The OBV dropped back to major support (line b) on the recent correction.
- There is minor support now in the $90 to $90.60 area.
The S&P 500 Energy Sector hit a high on September 14 at 574.54, but seems to be holding support in the 544 to 546 area, which also corresponds to the May 2012 highs (line c).
- The 38.2% Fibonacci retracement support is at 532.80, with the 50% support level at 520.60.
- The daily relative performance or RS analysis turned positive in July, as it moved through resistance (line e). The RS line has now dropped back to this level, which is now important support.
- The RS line moved back above its WMA yesterday, with key resistance at the downtrend (line d).
- The OBV has again moved back above its downtrend (line f), and it appears that the uptrend (line g) has held.
- A close back above daily resistance at 562.60 would be positive.
NEXT: Which of These Energy ETFs Are Good Buys?
|pagebreak|The SPDR S&P Oil & Gas Exploration (XOP) is a well diversified ETF whose top ten components do not make up more than 1.6% of the ETF. It has an expense ratio of 0.35% and yields 0.88%.
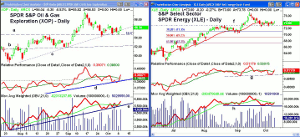
- XOP peaked at $59.80 in September, and eight days later hit a low of $54.22. This was a drop of 9.3% from the highs.
- XOP closed higher Tuesday on good volume. It has next resistance at $57.
- The early 2012 high was $61.76m and there is long-term resistance in the $63.50 to $65 area.
- The daily relative performance tested its long-term support (line d) and is back above its WMA.
- The daily OBV has completed its correction by moving above its previous highs, and has held long-term support (line e).
- The daily OBV did confirm the September highs.
- There is short-term support now at $54.67 (line a) with stronger levels in the $53.50 area and then $52.10 (line b).
The Select Sector SPDR Energy (XLE) is a less diversified ETF, as Exxon Mobil (XOM) makes up over 19% of the ETF. Chevron (CVX) is the second-largest holding at 15.6%. It has a yield of 1.6% with an expense ratio of 0.19%, and gives one good exposure to the major oil companies.
- From the September high at $77.35, XLE dropped to a low of $72.54, a decline of 6.2%.
- The support at $72.96 (line f) appears to be holding, with the 38.2% Fibonacci support at $71.20.
- There is further support at the early September low of $70.40. The 50% support sits at $69.23.
- The daily relative performance confirmed the recent highs and has turned up from support (line g).
- The RS line moved above its WMA on Tuesday.
- The daily OBV shows a similar pattern, and support (line h) appears to have held.
What it Means: Tuesday’s action suggests that the worst of the selling in these two energy ETFs is likely over. We still may see another retest of the lows, as the December crude oil contract could easily pull back to the $90.50 to $91.50 area. A strong weekly close will be consistent with the end of the correction.
There are quite a few energy companies that show positive long-term relative performance but they are still in corrective mode. I am likely to have several new buy recommendations in the energy sector in the coming weeks.
For those who are already long XOP as previously recommended, I would look to double the position at the levels suggested below, up to 2% of the portfolio. Because of its high weighting in XOM, I like XOP better than XLE. For the Portfolio, I will take a half position in XLE.
NEXT: How to Profit and The Current Charts in Play Portfolio
|pagebreak|How to Profit: For SPDR S&P Oil & Gas Exploration (XOP), go 50% long at $55.88 and 50% long at $54.76, with a stop at $51.34 (risk of approx. 7.1%).
For Select Sector SPDR Energy (XLE), go 50% long at $73.08 and 50% long at $72.74, with a stop at $68.86 (risk of approx. 5.5%).
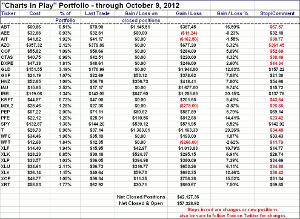
Portfolio Update: As I mentioned, earlier investors should be 50% long the SPDR S&P Oil & Gas Exploration (XOP) from $48.66, with a stop now at $51.34.
For Weatherford International (WFT), investors should be 50% long at $12.88 and 50% long at $12.46, with a stop at $11.79. WFT came close to our stop, and now needs to prove itself on the upside. It still could be bought in the $12.12 to $12.36 area with the same stop.


