More money is flowing into bonds than stocks despite Treasury yields reaching abnormal lows. Is this a wise strategy? MoneyShow's Tom Aspray shares his take on the bond market and the key levels that all bond investors should watch.
Bond experts and traders are trying to assess the global action of central banks, as the Bank of Japan’s action to expand its asset-buying program on Wednesday caught some by surprise. The yield on the ten-year Treasury Note dropped initially on the Fed’s action, but now is back to where it was before the announcement.
Money flow analysis suggests that investors are still moving money into bonds despite the sharp rally in stocks since the June lows. The price action of the major bond funds still looks positive, even though the yield on the ten-year Treasury Note has risen from the July low of 1.39% to 1.77%.
The dominant consideration, of course, is the Fed policy to keep rates low until the unemployment picture improves. But does that mean that bonds or bond funds are still the best place to invest now? Let’s take a look at the technical picture.
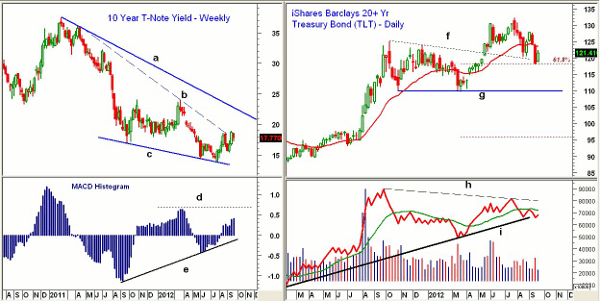
Chart Analysis: The short-term downtrend (line b) on the weekly chart of the ten-year Treasury Note was broken last week. The longer-term resistance from the 2011 highs (line a) waits in the 2.28% area.
- Yields were higher in March, around 2.4%, so a decisive close above this level would suggest a change in trend.
- The MACD-Histogram, which measures price momentum, crossed back into positive territory in early August. More importantly, as yields were making lower lows (line c), the MACD-Histogram was making higher lows (line e).
- This is a bullish or positive divergence. To confirm a weekly bottom, the MACD-Histogram needs to move above the resistance (line d).
- A drop in yields below 1.54% will suggest a new decline in yields is underway.
The iShares Barclays 20+ Yr Treasury Bond (TLT) has been a good proxy for the long bond, and is quite liquid, with a current yield of 2.77%.
- The weekly chart shows that TLT has dropped from the July high of $132.21 to a low last week of $118.05.
- The 61.8% Fibonacci retracement support calculated from the March lows is at $118.31, so a drop below last week’s lows would weaken the technical picture.
- The weekly chart shows that TLT has also retested the breakout level from May (line f).
- The weekly on-balance volume (OBV) formed a negative divergence at the highs (line h), and is testing its long-term uptrend (line i).
- A drop in the OBV below the March lows will indicate an important top is in place.
- The OBV is still below its slightly declining WMA, while the daily OBV (not shown) is negative.
- The 20-week EMA is at $123.50 with the previous swing high and key resistance at $127.72.
NEXT: Comparing This Year's Performance
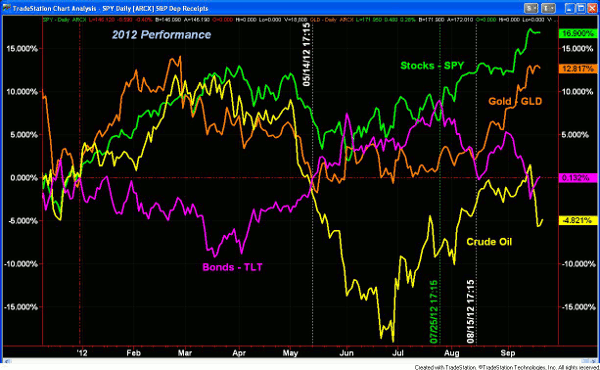
|pagebreak|The %Change charts from Tradestation that I have been featuring in the Week Ahead column have gotten quite a bit of interest. At the moment, it also gives an interesting perspective of TLT and the current status of the bond market.
This chart tracks the performance from the last day of 2011 through September 20. It shows that GLD, SPY, and crude oil all surged in the first two months of the year. I want to concentrate on three specific time periods.
- On the other hand, TLT was down just over 9% by March 19, while SPY was up over 12%. This is a 21% differential in less than three months.
- TLT improved steadily from the lows and crossed into positive territory on May 14.
- This coincided with crude oil and GLD turning negative for the year. GLD had been up close to 14.5% in February.
- TLT peaked on July 25, as it was up 9% for the year.
- Just two days later, the performance of SPY moved above that of TLT.
- By August 15, TLT was up only 0.6% for the year, and GLD was crossing above TLT.
- On September 13, TLT dropped below the zero line, while GLD was showing a 12.7% gain and SPY was up 14.7%.
What it Means: The long-term trend is still for rates to move lower, but the action of TLT over the next few weeks could provide the first evidence that the trend is changing.
As for new investments, I would keep the bond maturity of any new purchased geared towards the short end (three to ten years), where I feel the risk is lower.
For those with the majority of their portfolio in bonds, I would suggest taking some profits now and lower your commitment to bonds. I think high-yielding stocks are a better alternative.
It has been my opinion for some time that we will eventually see a more aggressive flow of funds out of the bond market, so income investors should not be complacent.
For the near term, I will be watching TLT for a successful retest of the lows, which could set up a buying opportunity.
How to Profit: No new recommendation for now, but will continue to look for good entry points in market-leading stocks that offer attractive yields.


