The technical readings of the markets suggest that stocks have plenty of room to run over the next few months, aside from a likely near-term correction that should be a good buying opportunity, writes MoneyShow's Tom Aspray.
The long-awaited FOMC announcement gave the market what it wanted and more. Bulls pushed stocks sharply higher, while those on the short side scrambled to get out of their positions.
The market internals were impressive again Thursday, as four stocks advanced for every one that declined. The number of stocks making new highs on the NYSE surged to the best level since April 2011. This action confirms that another round of easing was not already priced in the market.
From the financial media, it seems that many professionals have been skeptical of the stock-market rally over the past few months. This may be colored by their uniform dislike of President Obama and their inability to see any hope for the economy that could justify higher stock prices. As we head into the end of the quarter, these pros are likely underinvested in stocks, and could now help to push prices higher.
Though my technical work indicated a low in June, I have been too cautious on the market over the past month. The current technical readings suggest that stocks can still move significantly higher over the next few months. Let’s look at the evidence.
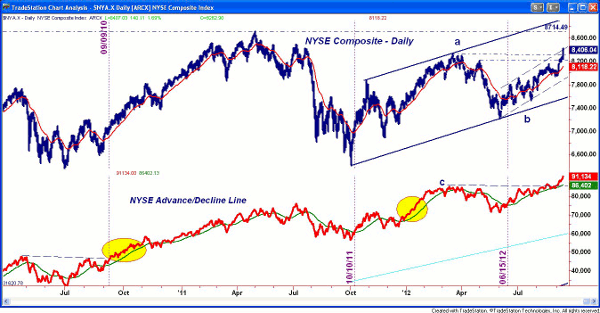
Chart Analysis: The close Thursday pushed the NYSE Composite above the highs from early in the year, as prices closed above the upper boundary of the daily trading channel.
- The April 2011 high for the NYSE at 8,714 is the next major target. This is 3.6% above current levels.
- The trend line resistance (line a) is now at 8,870, and the all-time high from October 2007 is at 10,387. A test of this level would mean a 23.5% rally from current levels.
- The NYSE Advance/Decline line has accelerated to the upside in the past week, as the resistance (line c) has been convincingly overcome.
- The NYSE A/D line had similar formations in October 2010 and early 2012, which are highlighted in yellow.
- The bearish divergence in the S&P 500 A/D line (not shown) has also been overcome. Typically, this occurs at the start, not the end, of a market rally.
- The NYSE Composite has first support now at 8,224. The 20-day EMA now sits at 8,118, which is 3.4% below current levels.
NEXT: How Strongly will the S&P 500 and Nasdaq Respond?
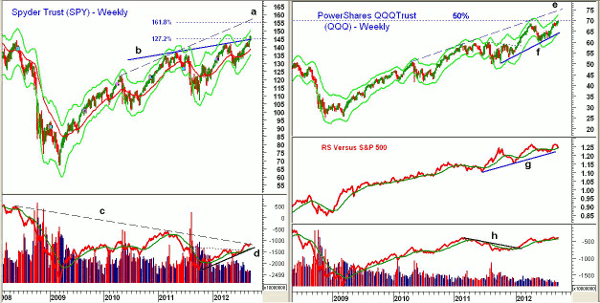
|pagebreak|The weekly chart of the Spyder Trust (SPY) shows this week’s move above the resistance from 2011, line b. The chart of the price projection analysis from January gave the 127.2% target at $145.27, which has now been exceeded.
- Using the same 2011 correction, the 161.8% target is at $155.65, which is just below the monthly Starc+ band for September at $156.50.
- The weekly Starc+ band is now at $149.15, and SPY closed on Thursday at the daily Starc+ band.
- Volume in SPY on Thursday was the highest since July, when the weekly on-balance volume (OBV) broke through resistance.
- The weekly OBV is now testing its long-term downtrend (line c).
- The OBV has failed to confirm the recent highs, as it is still below the 2011 highs.
- The first chart support is at $143.50, with the rising 20-day EMA at $142.40. This is 2.8% below Thursday’s close.
The Powershares QQQ Trust (QQQ) was up 1.3% Thursday, and the March high has been overcome.
- In March 2000, QQQ hit a high of $119.47. It dropped as low as $19.58 in 2002. Therefore, the 50% Fibonacci retracement resistance is at $70, with the 61.8% resistance level at $81.70.
- The weekly Starc+ band is at $71.90, with the monthly Starc+ band at $74.50. This is very close to the trend line resistance (line a) from the 2010 and 2011 highs.
- The weekly relative performance or RS analysis has been forming higher lows since early 2011, line g, but looks ready to close lower this week. It shows no signs yet of topping out.
- The weekly OBV has confirmed the new highs, but is in a shallow uptrend. It turned positive in early 2012, when the downtrend (line h) was overcome.
- There is first support now at $68.20 and the rising 20-day EMA. Further support sits at $67.40.
- The weekly uptrend (line f) is in the $65 area.
What it Means: The bullish action in the Advance/Decline line and positive price action is consistent with even higher stock prices over the next few months. Though there are a quite a few hurdles still in the way, a move back to the highs in the Spyder Trust (SPY) at $157.67 is not out of the question.
There are still some concerns, as the financial newsletter writers are still too bullish at 51%, and the Dow Transportation Average has not yet confirmed the action of the Dow Industrials.
On a short-term basis, a 2% to 3% correction is likely this month, which is consistent with the historical election-year pattern for September. This should be a buying opportunity, and I think the risk-reward will be best for individual stocks.
A correction may be brief, so it is recommended that you have your buy orders and stops in the market.
How to Profit: No specific new recommendations at this time. No need to chase either the Spyder Trust (SPY) or Powershares QQQ Trust (QQQ) at current levels
Portfolio Update: Investors should still be 25% long the Spyder Trust (SPY) from $132.85, as half was sold at $139.62 and half of the remaining position was sold at $142.48. Use a stop at $138.90 on what's left.
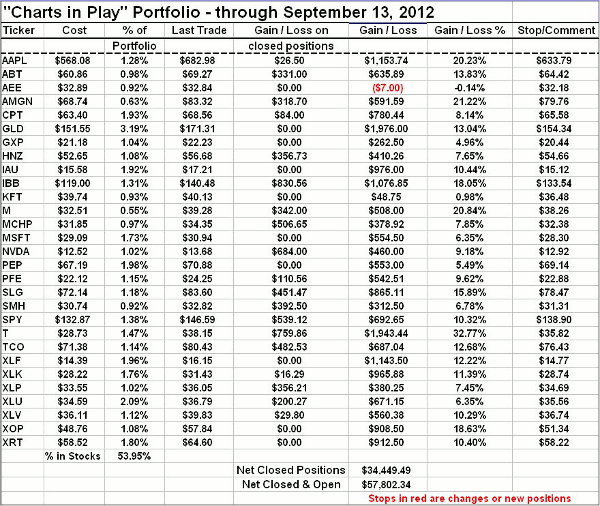
The “Charts in Play Portfolio” is about 48% long. See the updated portfolio here.
NEXT: The Updated Charts in Play Portfolio
|pagebreak|


