A look at this technically weak sector shows how even stocks that appear attractive by themselves may not be good buys if the overall sector has been disappointing, writes MoneyShow's Tom Aspray.
Stocks corrected Monday, but after the rally stalled last Friday, this was not too surprising. The markets are understandably skittish ahead of Wednesday’s important ruling regarding the Eurozone crisis and Thursday’s FOMC announcement.
If last week’s upside breakout was the start of a significant new push to the upside, then a further decline should be well supported. For those who don’t believe the recent market strength, it would take a drop back below last Thursday’s lows to weaken the outlook.
The Dow Industrials have been one of the weakest major market averages since the relative performance analysis (see chart) turned negative in early August. Since the end of July, the SPDR Diamond Trust (DIA) has gained 2.1%, versus a 4.2% gain in the Spyder Trust (SPY).
For most of 2012, the Dow Transportation Average has been even weaker than the Industrials, which is a sign of weakness for the overall market. The Transports did manage to gain 0.5% on Monday, versus a 0.39% loss for the Industrials.
While some analysts are look to some of the transportation industry groups for new buy candidates, the technical analysis of the truckers suggest that their recent strength may be short lived, and one large trucking company in particular looks ready to drop further.
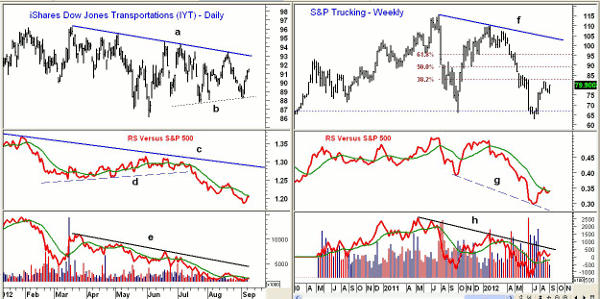
Chart Analysis: The chart of the iShares Dow Jones Transportations (IYT) has been forming lower highs since early in the year (line a). Recently, IYT has rallied nicely from the early September low of $88.13.
- There is next resistance in the $91.70 to $92.50 area.
- The relative performance or RS analysis broke support (line d) in the middle of July, signaling that it was weaker than the S&P 500.
- The RS has turned up, but is still below its WMA, and is in a clear downtrend (line c).
- The daily on-balance volume (OBV) broke support in early February, and shows a well-defined downtrend (line e).
- There is first support now at $89.50 to $90, with key support around $87.70 to $88.
The S&P Trucking Index has had a sharp 27% rally from the mid-July lows, and last week’s strong close after a two-week pullback was a short-term positive.
- The truckers violated the 61.8% Fibonacci retracement support from the 2009 lows in July, which is a negative sign.
- The 38.2% retracement resistance from the August 2011 highs is at 82.70, with the 50%R resistance at 89. This is the likely maximum upside for a further rally, as it also corresponds to strong chart resistance.
- The weekly relative performance has formed lower lows (line g), and shows no real signs of bottoming.
- The RS line is now trying to move back above its declining WMA.
- The weekly OBV has moved back above its WMA, but is still below the long-term downtrend.
- It is also negative that the OBV made lower lows.
- A drop below last week’s low of 75.60 would suggest the rally may already be over.
NEXT: Key Levels for 2 Individual Truckers
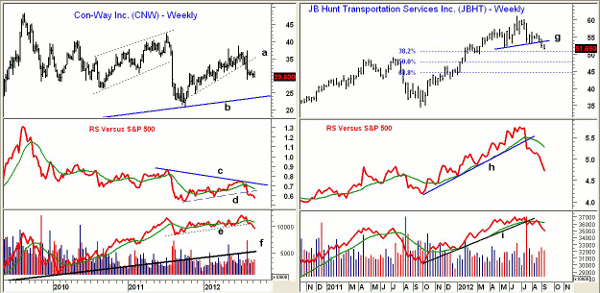
|pagebreak|Con-Way (CNW) is a $1.6 billion trucking and logistics company that rallied sharply from the market lows in 2009, but has since failed on several attempts to surpass those highs.
- The weekly support (line a) was broken in August, as the trucking group was moving higher. This indicates that CNW is one of the weakest stocks in a weak industry group that is part of a weak sector.
- A similar trading range was completed in early 2011, as CNW dropped from $42.39 to $21.98.
- The long-term support that goes back to the 2009 lows (line b) is now in the $24 area, which is 20% below current levels.
- The weekly RS analysis also dropped below its support (line d), confirming the price action.
- The weekly OBV has been stronger than prices since early 2010, but has now broken yearlong support (line e).
- The OBV is below its WMA, which is starting to turn lower.
JB Hunt Transportation Services (JBHT) is a much larger ($6.6 billion) company that has been participating in the recent market strength, as it made a new high in June at $61.18.
- It has since violated four-month support in the $53 area (line g), which could be the neckline of an H&S top formation.
- The 38.2% Fibonacci support is at $50.86, with the 50% support at $47.77.
- The weekly RS analysis broke its strong uptrend (line h) from the October 2011 lows in July. The RS line has since dropped well below its WMA.
- The OBV also broke its support in July (line i), as there was heavy volume the week ending July 21. The OBV needs to move back above its WMA to stabilize the outlook.
- There is strong resistance now at $53.80 to $55, and a close back above $56.60 would be positive..
What it Means: The divergence between the Industrials and Transports needs to be resolved to strengthen the market from a technical standpoint. Though the overall market can still move higher without the Transports, it could limit the upside..
The current market environment is not one where investors should be looking to buy weak stocks in weak sectors. These two trucking stocks looks quite negative, and they are likely to lead the market lower when it corrects.
Therefore, stick with market leading stocks like Wells Fargo (WFC) and BB&T (BBT), which I discussed yesterday.
How to Profit: No new recommendation for now.


