The high level of bearish sentiment early in the summer and the seasonal tendency for gold to bottom in July created a good risk-reward entry point, but another opportunity to buy should be just around the corner, says MoneyShow’s Tom Aspray.
The 8.8% gain in the SPDR Gold Trust (GLD) since the May 30 low is finally starting to get some attention from traders, as short-term bullish sentiment has increased. Mark Hulbert’s analysis of short-,term gold timers has risen 50% over the past two weeks.
On the other hand, investors seem to show little interest, as gold has been correcting for almost a year since it peaked in September 2011. Long-term bull markets, like that in gold, are characterized by periods of consolidation in which investor sentiment changes dramatically.
These pauses on the charts can be identified as continuation patterns, and the length of the pause can often be correlated to the level of bullish sentiment. When gold peaked in December 2009, the resulting correction lasted only three months, as that was long enough to turn many traders negative on the yellow metal.
The sentiment in the summer of 2011 was much more extreme. It was not until May and June that some long-term precious metals bulls began to turn more cautious.
The monthly OBV analysis is still positive for the long term, and I would not be surprised to see new price highs in 2013. For those you are not long the gold ETFs previously recommended in June, there should be a second good buying opportunity in the next few weeks. Let’s look at the technical picture.
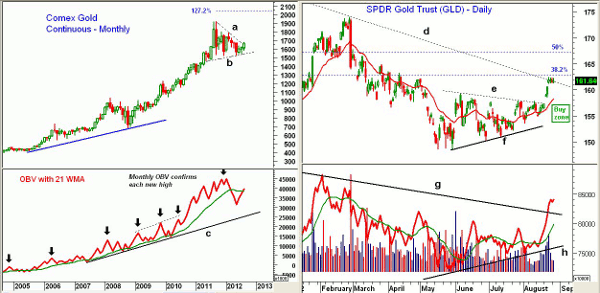
Chart Analysis: The monthly chart of the Comex gold futures shows that we are likely to complete the flag formation this month. There is next resistance in the $1,688 to $1,725 area.
- The 127.2% Fibonacci retracement target from the flag formation (lines a and b) is at $2,050.
- There is good monthly support in the $1,526 to $1,545 area.
- The monthly on-balance volume (OBV) should close above its WMA this week, which is a positive sign.
- The chart reveals that since 2004, the monthly OBV has confirmed each new monthly price high for the gold futures.
- The monthly OBV completed a major bottom formation in 2002.
- The seasonal trend analysis derived from over 30 years of data reveals that a low typically forms in July.
The daily chart of the SPDR Gold Trust (GLD) shows that the downtrend from the September 2011 and February 2012 highs (line a) is now being tested.
- The 38.2% Fibonacci retracement resistance is at $162.64, which is just above last Thursday’s high of $162.45. On a close above this level, the 50% retracement resistance stands at $167.07.
- The completion of the short-term triangle formation (lines e and f) last week was accompanied by strong volume.
- The 127.2% Fibonacci retracement target for GLD is at $197.50.
- The daily OBV has moved well above the highs going back to April, and has overcome the long-term downtrend (line g). The OBV is well above its rising WMA and support (line h).
- The rising 20-day EMA is now at $158, with the 38.2% support (calculated from $162.45) at $157.13.
- The green box on the chart represents the 38.2% to 61.8% retracement support, which should be an ideal buying zone.
- A daily close below $153.61 would weaken the daily chart.
NEXT: Tom's Verdict on 2 More Gold ETFs
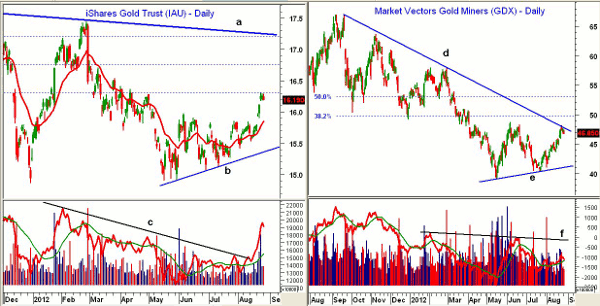
|pagebreak|The iShares Gold Trust (IAU) also just reached the 38.2% Fibonacci retracement resistance at $16.30 last week.
- The 50% retracement resistance is at $16.74, with the 61.8% resistance and further chart resistance is in the $17.19 area.
- There is initial support now at $16 and then at $15.85.
- The 38.2% Fibonacci retracement support from last Thursday’s highs is at $15.78, with the 50% support at $15.61. The 61.8% Fibonacci retracement support is next, at $15.45, with additional support in the $15.14 to $15.27 area.
- The daily volume surged last week, as the downtrend that goes back to early in the year (line c) has been decisively overcome.
- A pullback in the OBV to its WMA should be a good buying opportunity.
The gold miners have also rallied, but the Market Vectors Gold Miners (GDX) has just reached its long-term downtrend (line e).
- The 38.2% retracement resistance is at $49.73, with the 50% resistance level at $53.02.
- The OBV is barely above its WMA, but well below the major resistance (line f). This needs to be overcome to signal that a bottom is in place.
- A drop in the OBV below the July lows would be negative.
- The weekly OBV (not shown) is just barely above its WMA
- There is initial support now at $45.50 to $46, with stronger levels in the $42.50 to $44 area.
What it Means: The hopes for new action by the Fed and the potential for QE3 has encouraged some traders to buy gold. That, in my opinion is not a good reason to buy.
The technical action of the gold ETFs does suggest that a pullback—perhaps in reaction to Bernanke’s speech later in the week—should create a new buying opportunity in GLD or IAU for those who are not long. But I would not buy GDX at this time.
Alternatively, one could wait until we get a daily close above the 38.2% retracement resistance level, and then look for a few tight range days to buy. I would not be surprised to see gold make significant new highs by the first half of 2013.
How to Profit: For those who did not buy the iShares Gold Trust (IAU) as recommended previously in early or late July, go 50% long at $15.88 and 50% long at $15.63, with a stop at $14.95 (risk of approx. 5.2%).
For the SPDR Gold Trust (GLD), go 50% long at $158.44 and 50% long at $157.32, with a stop at $151.58 (risk of approx. 4%).
Portfolio Update: As per the July 31 column, investors should be 50% long IAU at $15.66 and 50% long at $15.48, with a stop at $14.95.
Investors should also be 50% long the SPDR Gold Trust (GLD) at $152.42 and 50% long at $150.28. Use a stop now at $149.65.
For investors who bought IAU in early July, they should be 50% long at $15.68 and 50% long at $15.42, with a stop at $14.79.


