Investor distrust of equities and fear of another recession has caused a steady flow of funds to the Treasury market, despite the potential for negative total returns...and technically, rates can still go lower, says MoneyShow’s Tom Aspray
As the markets wait for the monthly jobs report, the recent statistics on fund flows reveals that money continues to move out of stocks and into bonds. This is despite the drop in the ten-year Treasury yield from a close of 2.39% in February to 1.40% recently.
A more sensitive indicator on bond market sentiment, the NOB spread, was discussed in early May. When the spread is rising, it indicates that the pros in the bond market are buying bonds and shorting ten-year Treasury notes, as they expecting rates to drop as investors move out of stocks and into the safety of the Treasury market.
So do the bond pros show any change in sentiment, or can yields still go lower?
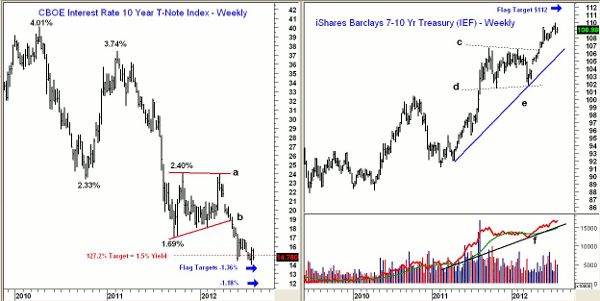
Chart Analysis: The weekly chart of the ten-year T-Note shows the steady decline in yields from the early 2010 high of 4.01%. The downtrend is clearly still intact, as it would take a move back above 2.40% to turn things around. The recent low was 1.39%.
- The flag formation that formed between September 2011 and March 2012 (lines a and b) was completed in early May. This is a classic continuation pattern, and the 127.2% retracement target from the flag formation at 1.5% has already been exceeded.
- One can also measure the width of the flag at its narrowest as well as its widest point to get additional targets. This distance is then subtracted from the breakout level, which gives a first target of 1.36%. This has almost been met.
- An additional target is at 1.18%, which would mean almost a 20% decline from current levels.
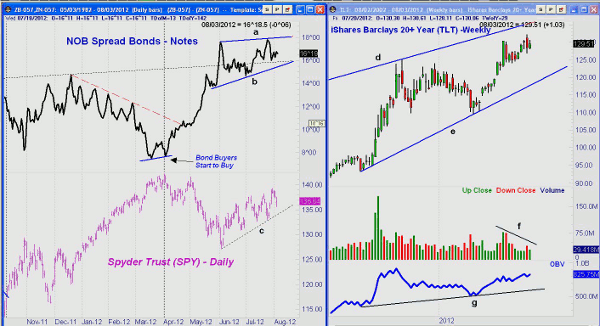
The iShares Barclays 7-10 Yr Treasury ETF (IEF) tracks the performance of Treasuries with a remaining maturity of over seven but less than ten years. Its current yield is 2.21%, with an expense ratio of 0.15%.
- The weekly chart shows that the continuation pattern (lines c and d) was completed by mid-May.
- The 127.2% Fibonacci target at $108.20 was easily exceeded in early June.
- The measured target from the flag formation is $112, which is 2.7% above yesterday’s close.
- The weekly on-balance volume (OBV) confirmed the completion of the flag formation. It is positive, and has continued to make new highs.
- There is initial support at $108.50, with $108.20 to follow. A close below $107.50 would weaken the uptrend.
NEXT: A Crucial Indicator to Watch
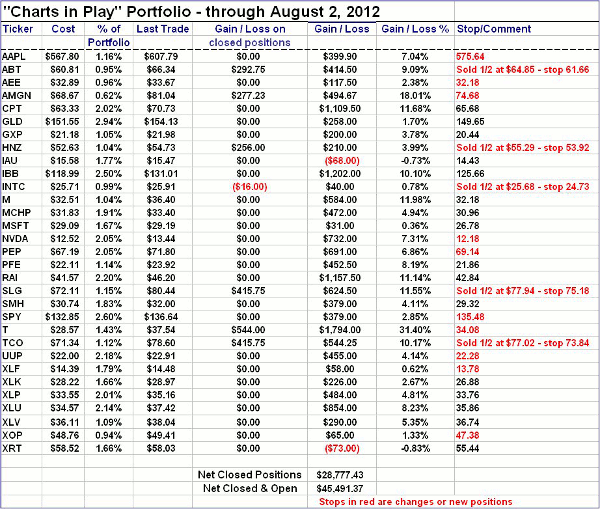
|pagebreak|The NOB Spread, as I discussed earlier, measures the T-Bond-T-Note spread. The spread formed higher lows in early April, when the Spyder Trust (SPY) formed higher highs and subsequently topped out.
- The spread is currently in a trading range (lines a and b). This is most likely a continuation pattern that when completed to the upside will project another move higher in the spread.
- This would mean another move lower in yields, with upside targets for the spread in the 21 area.
- It would take a drop below the early July lows to suggest that the spread has topped out.
- More important support for the spread at the June lows.
The weekly chart of the iShares Barclays 20+ Year ETF (TLT) shows that it had a wide range last week, from a low of $126.96 to a high of $132.21.
- The $126 to $127 level is therefore first support, with more important levels following in the $124 area.
- There is weekly trend line resistance (line d) in the $134.50 area.
- Volume surged in early June, but has been declining since (line f).
- The weekly OBV is well above its long-term uptrend (line g), but is still below the 2011 highs.
- The daily OBV (not shown) is positive, and still above its WMA
What it Means: Though the short-term direction in rates is likely to be determined by today’s job report, the longer-term trend is still for lower rates. A weekly close in the 30-Year T-Bond yield will signal a drop to the 2.20% area.
As I discussed yesterday, the market internals have not been confirming the price action. Even if stocks rally sharply on a better than expected jobs number, it would not be enough to reverse these signs of deterioration.
A further correction in the stock market could complete a short-term low in yields. Traders should look to buy the iShares Barclays 7-10 Yr Treasury (IEF) on a pullback to support, with tight stops. I will keep monitoring the NOB Spread, because when it tops out, it will be very positive for the stock market.
How to Profit: For iShares Barclays 7-10 Yr Treasury (IEF) go long at $108.22 with a stop at $107.43 (risk of approx. 1%). Sell half at $111.76 or better. Cancel if $109.30 is hit first.
Portfolio Update: We went 50% long iShares Barclays 20+ Year Treasury Bond Fund (TLT) from May 10 at $117.93, then sold half at $124.73. The remaining half was stopped out at $127.94.
Aggressive traders, as per the June 14 column, were long the iShares Barclays 20+ Year Treasury Bond Fund (TLT) at $125.66 or better. Half the position was sold at $129.76, and the rest was stopped out at $127.94.
NEXT: See the Updated Charts in Play Portfolio
|pagebreak|


