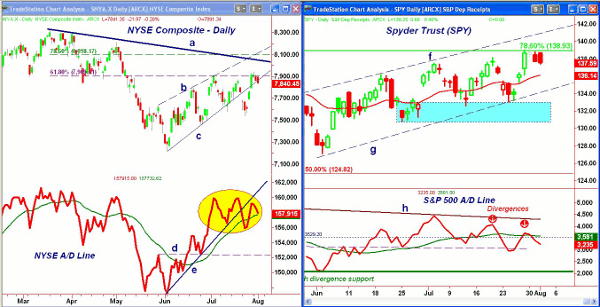
Although the market is susceptible to news from Europe or the Fed that could still push the major averages higher, not enough stocks have participated in the recent rally and the technical "Red Flags" are warning of an impending correction.
In early Thursday trading, the markets are higher as they try to absorb the disappointment that the FOMC did not take any real action. The Fed's acknowledgement that the economy had weakened further did not help stocks Wednesday. On a short-term basis, the focus is now on the ECB to see what action they may take.
The stock-market rally from last week’s lows has been weak technically, as the Advance/Decline lines on the major averages have been weaker than prices. This means that fewer stocks have been moving the indices higher, and this makes the market more vulnerable to a decline.
Though the ECB announcement and Friday’s monthly job report will clearly control the action, it would take more than a couple of strong days to turn the technical outlook around. This, of course, could happen, but in most cases these technical formations lead to a market correction.
Let’s look at the evidence, and also where the major averages are likely to find support.
Chart Analysis: The NYSE Composite has been testing the 61.8% Fibonacci retracement resistance, but has not yet closed decisively above it.
- There is much more important resistance at 8,000 to 8,098, which is the 78.6% resistance level. A close above this level is needed to confirm a new uptrend.
- The NYSE A/D line broke its uptrend (line e) last week. It has now rallied back to this resistance, and shows a potential top formation.
- A drop below last week’s lows will start a new downtrend, with good A/D line support at line d.
- For the NYSE, there is minor support now at 7,700, with more important levels at 7,540, which is 3.8% below Wednesday’s close. This I would consider a soft landing.
- Very important support sits at 7,220 and the June lows.
The Spyder Trust (SPY) exceeded the 78.6% Fibonacci retracement resistance at $138.98 but has not yet closed above it. There is additional resistance in the $140 to $142 area.
- There is minor support for SPY at $136.14 and the 20-day EMA with the daily uptrend (line g) at $134.35.
- There is a more important zone of support (in blue) at $133 to $130.85, which is 3.3% to 4.8% below Wednesday’s close. This is the soft landing zone.
- There is, of course, more important support at $129 to $127.14, with the major 50% retracement support at $124.82.
- While SPY made higher highs in the past few weeks, the S&P 500 A/D line has formed lower highs (see arrows).
- These two negative divergences are a sign of weakness that would be confirmed if the A/D line drops below last week’s lows.
- It would take a move above these highs and the major downtrend (line h) to turn the A/D line back to positive.
NEXT: What About the More Volatile Indexes? |pagebreak|
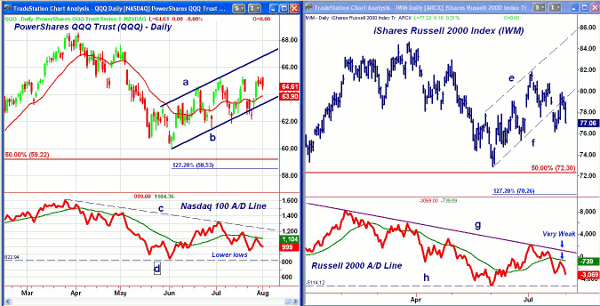
The Powershares QQQ Trust (QQQ) has had a high over the past three days of $65.32, which matches the July 19 high, while the July 5 high was a bit lower at $65.25.There is minor support now at $63.90 and the 20-day EMA.
- There is further support at $62 to $61.51, which is 4.7% below current levels.
- A drop to the June lows at $60.04 would imply a decline of 7%, with the 50% retracement support next at $59.22.
- The Nasdaq-100 A/D line was stronger than prices in late June, but has been weaker in July.
- While the Nasdaq-100 has been challenging its highs, the A/D line has made lower highs, and is still below its WMA. The A/D line has also made lower lows, which is a further sign of weakness.
- A close above the 61.8% resistance at $65.29 would signal a move to the 78.6% resistance at $66.72.
The iShares Russell 2000 Index (IWM) closed Wednesday below last Friday’s lows, as it has continued to act weaker. There is next support in the $75.40 to $76.50 area.
- There is further support at $74 to $72.94, which was the June low.
- The major 50% Fibonacci retracement support is at $72.30. The 127.2% Fibonacci retracement levels calculated from the June rally is at $70.25. A drop to this level would be a hard landing, as it is 8.8% below current levels.
- The Russell 2000 A/D line failed to overcome long-term resistance (line g) in early July, and dropped below its WMA on July 20.
- It is a sign of weakness that the A/D line has just rallied back to its declining WMA this week.
- A strong close in the A/D line above the July highs is needed to turn the A/D line positive.
- IWM has strong resistance now in the $78.80 to $80 area.
What it Means: This article is being submitted before the ECB announcement. If they surprise the markets with decisive action, it could be enough to power the major averages to new rally highs. A new round of easing by the ECB and more importantly the Fed should create a floor under stock prices.
The short-term technical outlook paints a different picture, as it suggest the Spyder Trust (SPY) could decline to the $133 to $130.85 area. A decisive close under $130 would be more negative. It looks like the small-cap stocks will continue to lead the market lower.
A correction over the next few weeks does not rule out a higher market by the end of the year, so I would recommend using stops on the individual positions, not the market.
How To Profit: Investors should be long the Spyder Trust (SPY) from $132.85. Raise the stop to $135.48. On a move above $139.40, raise the stop further to $137.74. Sell ½ at $139.62 or better.
- To review the Charts in Play Portfolio, click here.


