The high degree of negative sentiment on the Eurozone economies and the heavy bearish bet on the euro could be signaling a turnaround. If Europe recovers, the companies that depend on Europe for a large part of their revenues could emerge as new market leaders, says MoneyShow’s Tom Aspray.
The sentiment shifted last week on the Eurozone, and many are expecting some concrete action by the ECB this week. Certainly, the short covering in the Euro as well as the stock index futures was impressive.
Despite the prevailing gloom over Europe’s economy and the deterioration in most economic statistics, Germany’s stock market has done quite well. As I noted in the Week Ahead column last Friday, “the German Dax has outperformed the Spyder Trust (SPY) by over 2.5% so far in 2012."
It clearly will take some time before the Eurozone economy can really turn around, as stock prices generally turn ahead of the economy. The last US recession was officially over in June 2009, but the stock market bottomed in March of 2009.
These three stocks get over 25% of their revenues from Europe, and have been weaker recently than the S&P 500. If Europe’s economy turns around later this year, these three stocks—which also have attractive dividends—should do well.
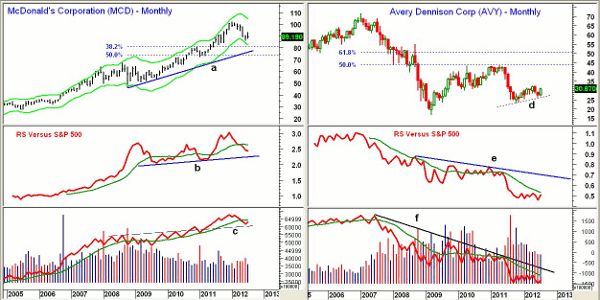
Chart Analysis: McDonald’s (MCD) peaked at $102.20 in January as it came very close to its monthly Starc+ band. Their latest earnings released on July 23 missed expectations and pushed the stock almost 3% lower. Approximately 40% of their revenues come from Europe.
- In May, MCD had a low of $85.22, as it almost reached its lower monthly Starc- band.
- The 38.2% Fibonacci retracement support from the 2008 low is at $80.55, with the weekly uptrend (line a) in the $76.75 area.
- The monthly relative performance or RS analysis did confirm the highs early in the year, but has now dropped back below its WMA.
- The RS line is holding well above long-term support (line b).
- The monthly on-balance volume (OBV) did confirm the January highs and has now dropped back to support (line c). It is below its WMA.
- The weekly RS analysis (not shown) is still also negative, but the OBV has bounced back above its WMA.
- There is initial resistance now at $90.25 to $90.75, with further at $93.32, which was the pre-earnings high.
- MCD currently pays a dividend of $2.80 and yields 3.1%.
Avery Dennison (AV) is a $3.2 billion diversified machinery company that manufactures and sells pressure sensitive materials.
- AVY traded as high as $43.52 in early 2011 before dropping sharply into the end of the year.
- The monthly chart shows a slight uptrend (line d), as it looks ready to close the month on its highs.
- There is next resistance at $32.78 and then in the $34 area.
- The relative performance is trying to turn up, but is still below its WMA.
- The monthly OBV has been trading near its lows for the past few months, and is still below its WMA.
- The weekly RS and OBV analysis (not shown) is positive, suggesting that the June low at $26.18 will hold.
- There is first support now at $29 to $29.50, with much stronger levels in the $27.20 area.
- AVY currently pays a dividend of $1.08 and yields 3.5%.
NEXT: A Blue Chip Industrial with an Interesting Chart |pagebreak|
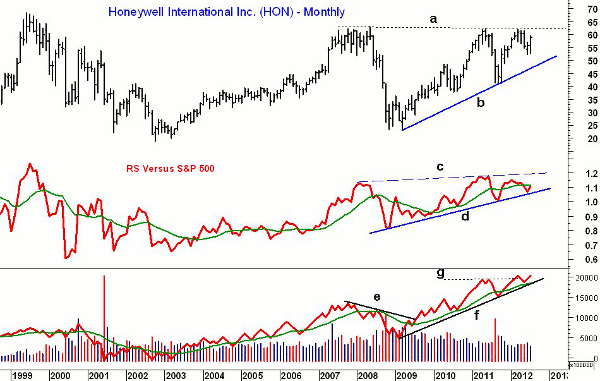
Honeywell International (HON) is a $46 billion aerospace/defense industry company that has quite an interesting monthly chart. The resistance (line a) in the $62.20 to $63 area goes back to 2007.
- The strong close in July is positive, and could be setting the stage for a test of this major resistance.
- The monthly RS analysis has turned up, and is very close to moving above its WMA.
- The weekly RS line (not shown) is above its WMA.
- The monthly OBV is very close to the all-time highs that were made in March. The OBV did overcome resistance (line g), and has good support at the uptrend (line f).
- When the monthly OBV overcame its downtrend (line e) in August 2009, it was the start of a two-year rally.
- There is first support now at $56.50 to $57 and the June highs. There is stronger at $54.70 to $55.40.
- HON currently pays a dividend of $1.49 and yields 2.5%.
What it Means: This could be quite an interesting week, as the market internals continue to support the bear flag scenario. Therefore, I am cautious about the recent rally.
I would be interested in buying MCD on a drop to new correction lows, and will be watching AVY since last week’s wide range makes an entry difficult.
The monthly chart of HON suggests a significant opportunity may lie ahead. Often, breakouts on monthly charts signal the start of start of major new trends. For example, IBM (IBM) broke out of a ten-year trading range in September 2010, and traded above $210 early this year.
How to Profit: For McDonald’s (MCD), go 50% long at $85.72 and 50% long at $84.84, with a stop at $80.22 (risk of approx. 5.9%).
For Honeywell International (HON), go 50% long at $55.94 and 50% long at $55.06, with a stop at $52.48 (risk of approx. 5.4%).


