Short interest surged last month in one popular semiconductor ETF, and several of the leading chip stocks surprised the street with their earnings this week. For those who are not in chip stocks, this ETF and one low priced chip stocks could still be bought, writes Tom Aspray.
It has been a wild summer for the semiconductor group, as early in the month Advanced Micro Devices (AMD) predicted sales will drop 4% in current period, and then yesterday reported an earnings drop of 40%. Its stock is down 20% from the early July highs.
On the other hand, Intel (INTC) beat earnings estimates by 2 cents, and surged 3.3% on Wednesday on almost double the average volume. Qualcomm (QCOM) was up almost 4%, as profits jumped, although revenues were lower than expected.
The sector has had a rough year in general. The Market Vectors Semiconductor ETF (SMH) has dropped as much as 20% from the February highs. The short interest in this ETF jumped almost 70% in the last half of June. Intel (INTC) makes up almost 20% of this ETF, while Taiwan Semiconductor Manufacturing (TSM) accounts for over 13%.
TSM reported its second-highest quarterly profit on sales of chips for smartphones and tablets. The stock was up sharply Wednesday, but down over 2% on Thursday.
Those negative on the US economy and worried about a hard landing in China are negative on this industry group, but the technical action has clearly improved.
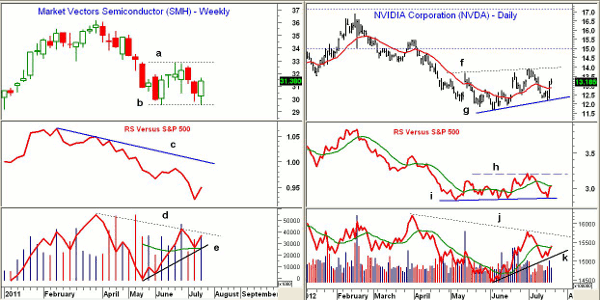
Chart Analysis: The weekly chart of the Market Vectors Semiconductor ETF (SMH) shows a potential double-bottom formation as Tuesday the June lows at $29.57 were exceeded by just a penny.
- Of course, to complete the formation, SMH needs to close above $32.82, which would project a move to the $36 to $36.50 area.
- The relative performance, or RS analysis diverged from prices at the March highs, and is well below resistance (line c).
- The weekly on-balance volume (OBV) has formed a strong bullish divergence at this week’s lows (line e), and is above its WMA.
- A move in the OBV through the downtrend (line d) will confirm the bullish outlook.
- Support now sits at the midpoint of this week’s range, in the $30.50 to $30.75 area.
NVIDIA (NVDA) reports earnings on August 9, and had a 39% increase in short interest in the last half of June. The daily chart shows key resistance now in the $14 area (line f).
- A close above this level would complete the bottom formation (lines f and g), with the 38.2% Fibonacci retracement resistance at $15.
- The chart formation has upside targets in the $16.50 area.
- The RS analysis also shows a potential double-bottom formation (line i), but needs to overcome the resistance (line h) to signal that it has become a market leader.
- The daily OBV is acting much stronger than prices (line k), and is back above its WMA.
- A move in the OBV above its downtrend (line j), would be a sign of strength.
- There is support now in the $12.35 to $12.75 area.
NEXT: A Small Cap Chip Maker with Potential |pagebreak|
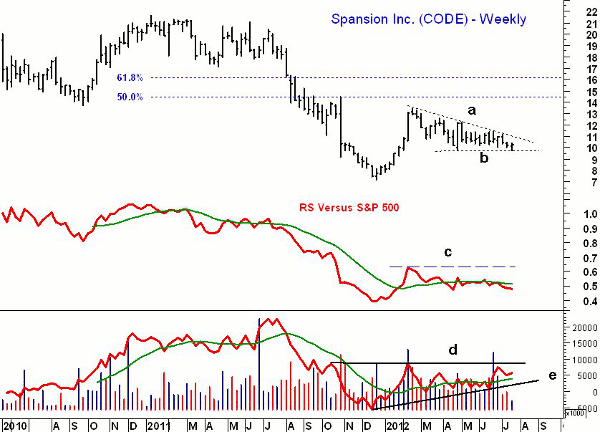
Spansion (CODE) is a $600 million designer and manufacturer of flash memory chips that reports earnings on July 31.
- CODE peaked at $13.45 in February, and has so far held above the 61.8% support at $9.58.
- The weekly chart shows a triangle formation (line a and b), with key resistance now in the $11.20 area.
- The weekly RS line is still below its WMA, with key resistance at line c.
- The weekly OBV shows a pattern of higher lows (line e), which suggests that the stock is being accumulated.
- The OBV is above its WMA, and there is major resistance now at line d.
- There is support now in the $9.90 to $10.10 area.
What it Means: Stocks are under pressure early Friday, suggesting the market may be ready for a near-term correction. The daily technical studies are positive, but the NYSE Advance/Decline line has tested but not yet exceeded last week’s highs.
I have liked the tech sector since late June, and the volume action in Market Vectors Semiconductor ETF (SMH) and Spansion (CODE) suggests that they are now bottoming. Those who are not long Intel (INTC), NVIDIA (NVDA), or Microchip Tech (MCHP) as previously recommended should consider SMH, or higher-risk traders could look to Spansion (CODE).
How to Profit: For Market Vectors Semiconductor ETF (SMH), go 50% long at $30.88 and 50% long at $30.46, with a stop at $29.22 (risk of approx. 4.7%).
For Spansion (CODE) go 50% long at $10.12 and 50% long at $9.96, with a stop at $9.34 (risk of approx. 7%).
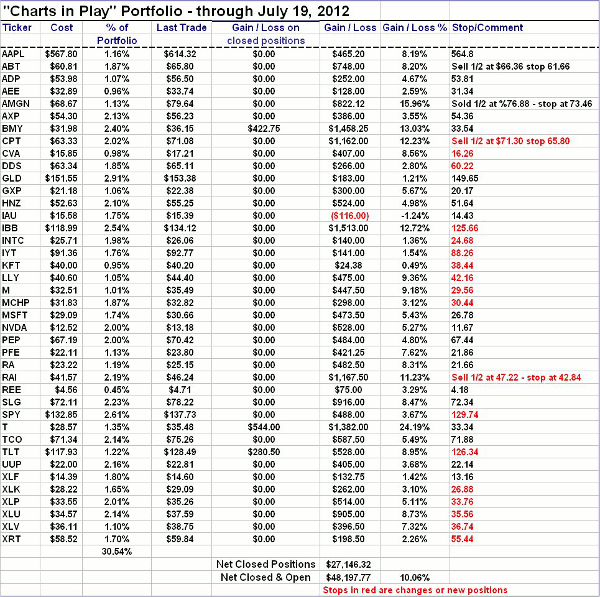
Portfolio Update: For Intel (INTC), investors should be 50% long at $25.88 and 50% long at $25.44. Raise the stop to $24.68.
For Microchip Tech (MCHP), investors should be 50% long at $32.08 and 50% at $31.44, with a stop now at $30.44.
For NVIDIA (NVDA), investors should be 50% long at $12.64 and 50% long at $12.36, with a stop now at $11.67.
NEXT: See the Charts in Play Portfolio |pagebreak|


