The technical action of crude oil and two popular oil ETFs suggests they are in the process of bottoming, but MoneyShow’s Tom Aspray suggests you remain patient and concentrate on market-leading oil stocks.
The market has been quite strong this week, as better-than-expected earnings have surprised many investors. This could turn out to be a better earnings season than most expect, and as I discussed last week, it could be enough to kick off a strong year-end election rally.
The market internals like the NYSE Advance/Decline line are positive, but have not yet confirmed a major new uptrend, so the “Bear Flag or Bear Trap? debate” has not yet been resolved. It could be today if the A/D ratios are positive.
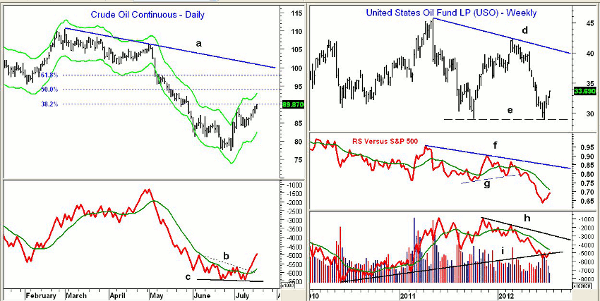
The September crude oil contract is up over 16% from the June low of $77.70, and while the daily technical studies are positive, the weekly analysis suggests that a bottom has not yet been completed. Some of the oil stocks like Diamond Offshore Drilling (DO) are already leading the S&P 500 higher, after Diamond announced earnings along with a special cash dividend this morning.
Chart Analysis: The daily chart of the continuous crude oil contract shows that the 38.2% Fibonacci retracement resistance at $89.90 is now being tested. The daily Starc+ band is now just above $93.
- The 50% retracement resistance is at $94, with the key 61.8% resistance at $98.
- The daily on-balance volume (OBV) appears to have completed a short-term bottom formation (line c), as resistance (line b) has been overcome.
- The weekly OBV (not shown) is still well below its WMA.
- There is initial support now at $87, with stronger levels in the $84.50 to $85 area.
The United States Oil Fund LP (USO) tracks the performance of the West Texas intermediate light sweet crude oil contract, and has an expense ratio of 0.65%. The weekly chart shows a potential double bottom (line e).
- The next strong resistance stands in the $35 to $37.70 area, with the long-term downtrend (line d) just above $40.
- The relative performance, or RS analysis broke support (line g) in March, and then proceeded to plunge.
- The RS line has turned up, but is still well below its declining WMA.
- The weekly OBV has dropped below long-term support (line i), but is now turning higher.
- There is resistance for the OBV at its WMA, with more important levels at the downtrend (line h).
- The daily chart shows that volume has been declining since early July.
- There is initial support now at $32.80, with stronger levels in the $31.30 to $31.70 area.
NEXT: 2 Oil Plays with Bright Prospects
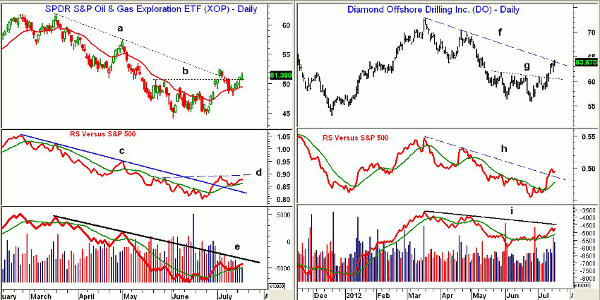
|pagebreak|The SPDR S&P Oil & Gas Exploration ETF (XOP) has 75 holdings, with the top ten comprising only 17% of the fund. It has a low expense ratio of 0.36%. The daily downtrend (line a) was broken in early July before XOP pulled back to just below its 20-day EMA.
- XOP closed Wednesday just above former resistance (line b) in the $50.75 area, with the July high to follow at $52.38.
- The 50% Fibonacci retracement resistance is at $53, with the 61.8% resistance at $55.15.
- The RS line moved through its downtrend (line c) in late June. It is above its WMA, but needs to move above resistance (line d) to confirm a bottom.
- The daily OBV is barely above its WMA, but still well below the daily downtrend (line e).
- There is first support at $49.80 to $50.20, and then more important levels in the $48.50 area.
Diamond Offshore Drilling (DO) closed Wednesday at the daily downtrend (line f) in the $64 area. The 50% Fibonacci retracement resistance from the March high of $72.80 is at $64.30.
- The 61.8% retracement resistance is at $66.30.
- The relative performance has broken its downtrend (line h), and is well above its rising WMA.
- The volume has been increasing nicely over the past few weeks, and the OBV is above its WMA.
- The daily OBV has important resistance at the downtrend (line i).
- The weekly OBV (not shown) is above its WMA.
- There is initial support now at $62.40, with more important levels in the $60.60 to $61.20 area.
What it Means: Given last week’s close in crude oil, I was looking for greater strength in the energy markets this week. Though oil prices have likely seen their low, I would not be surprised to see a drop back toward last week’s lows before the bottom formations are complete.
Some stocks like Diamond Offshore Drilling (DO) are already leading the S&P 500 higher, but with this morning’s surprising announcement of a cash dividend, it is likely to move sharply higher over the near term. Therefore, I would only look to buy it on the next pullback.
How to Profit: For SPDR S&P Oil & Gas Exploration ETF (XOP), go 50% long at $48.66 and 50% long at $47.90, with a stop at $45.88 (risk of approx. 5%).
For Diamond Offshore Drilling (DO), go 50% long at $60.86 and 50% long at $59.90, with a stop at $57.72 (risk of approx. 4.4%).


