Technical signals suggest that two of the most oversold stocks on the Nasdaq 100 appear close to bottoming out while two other high yield tech plays also look attractive as we head into earnings season.
The sharp gains last Friday in the overall market, especially the financial sector, helped stabilize the stock market after its six-day slide. Still, further gains are needed this week to keep the rally from the June lows from failing.
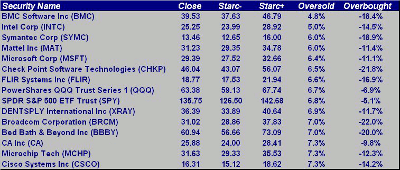
If the recent correction is indeed a buying opportunity, the Nasdaq-100 stocks that are closest to their weekly Starc- bands is a good place to look for stocks to put on our buy list.
Those stocks that are closest to the weekly Starc- band are lower-risk buys than those that are close to the Starc+ bands. On the top of the list is BMC Software (BMC), which is just 4.8% above its weekly Starc- band. This is in contrast to Seagate Technology (STX), which is up 19% from the June lows and is 23.6% above its weekly Starc- band.
Each of the 15 stocks that are at the top of the list were then examined to determine whether their intermediate term relative performance and the volume analysis was positive. The monthly and daily analysis are also reviewed as the monthly charts can be quite helpful in determining key support levels and in assessing the risk of new long positions.
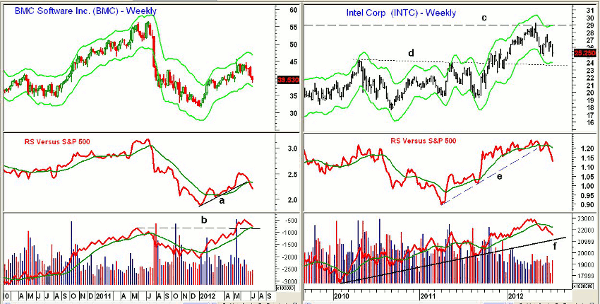
Chart Analysis: BMC Software (BMC) is a $6.37 billion application software company that reports earnings on July 31. BMC peaked at $45.76 in May and traded as low as $38.76 last week. This was fairly close to the weekly Starc- band at $37.94.
- The 50% Fibonacci retracement support from the January lows was reached last week, with the 61.8% support at $37
- The relative performance has dropped below its WMA, but did confirm the recent highs
- The weekly on-balance volume (OBV) has just pulled back to good support (line b) and the rising WMA
- The monthly OBV did make new highs in June
- There is initial resistance now at $40.50 to $41, with stronger levels in the $43 area
Intel (INTC) is a bellwether technology stock that reports its earnings after the close on July 17. The second-quarter revenue warning from AMD (AMD) has the chip sector nervous, and put more focus on INTC, which closed on the lows last week.
- INTC has good support now in the $27 to $27.70 area, with monthly support going back to late 2011 in the $23 to $22.50 area
- The RS line has dropped sharply in the past two weeks and has broken its uptrend (line e), as INTC has been weaker than the S&P 500
- The RS line did confirm the recent highs
- The weekly OBV also made new highs in May, confirming the price action
- The OBV has dropped below its WMA, but is above long-term support (line f)
- The monthly OBV (not shown) does look much more positive
- There is initial resistance now at $26.80, with stronger levels at $27.75. There is multi-year resistance at $29 (line c)
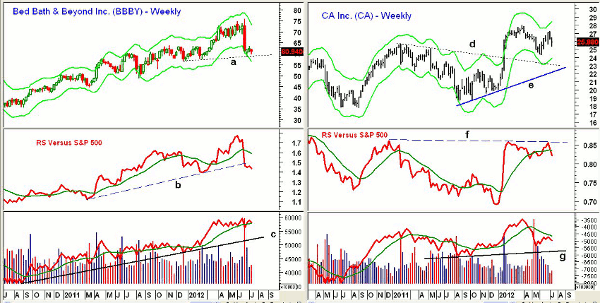
Bed Bath & Beyond (BBBY) shocked the street in late June with a disappointing outlook for earnings, even though the first-quarter results were better than expected. From the June high of $75.84, the stock hit a low of $59.76 last week.
- The weekly chart shows good support in the $59 area (line a), with the February low to follow at $57.58
- The relative performance analysis confirmed the recent highs before reversing, as it dropped below its WMA and the uptrend (line b)
- The weekly OBV is acting much stronger, as it is above its WMA and well above the long-term uptrend (line c)
- There is first resistance in the $63.70 to $65.70 area. Major resistance awaits in the $68 area
CA Technologies (CA) is a $12.2 billion application software company that currently yields 3.9%. The company reports earnings on July 26.
- The weekly chart shows that it completed a triangle formation (lines d and e) in early 2012
- There is next support in the $24.29 to $25.20 area, with stronger levels at $23.10 (line d)
- The relative performance has turned down from resistance (line f), and is now below its WMA
- The weekly OBV is below its WMA, but has important support now at line g
- The daily OBV (not shown) is below its WMA, but is trying to turn up
- A close above the resistance at $27.24 is needed to reassert the uptrend
What it Means: BMC Software (BMC) and Bed Bath & Beyond (BBBY) look closer to an important low—especially BBBY, as it has already reported earnings.
The longer-term analysis for Intel (INTC) does point to higher prices, but it may be vulnerable going into Tuesday’s earnings report. CA Technologies (CA) looks attractive at lower levels due to its high yields and positive longer-term analysis.
How to Profit: For BMC Software (BMC), go 50% long at $38.22 and 50% long at $37.72, with a stop at $3622 (risk of approx. 4.6%) Cancel if not filled by July 27.
For Bed Bath & Beyond (BBBY), go 50% long at $59.22 and 50% long at $58.44, with a stop at $56.84 (risk of approx. 3.4%).
For CA Technologies (CA), go 50% long at $24.22 and 50% long at $23.68, with a stop at $22.94 (risk of approx. 4.2%).
Portfolio Update: For Intel (INTC), investors should be 50% long at $25.88 and 50% long at $25.44, with a stop at $23.94.


