The retail sector usually bottoms a month or two from now, but the charts of these two retail stocks and the leading retail ETF are flashing signs that they may bottom ahead of schedule this year.
As we head into the middle of the summer and the start of earnings season, investors are nervous that this summer will be a repeat of last year. The Spyder Trust (SPY) peaked just after July 4 last year at $135.70, and less than four weeks later had dropped to $110.70.
In addition to the continuing worries over the Euro debt crisis, the health of the US Consumer is also being watched closely, with the latest reading from the University of Michigan due out this Friday..
One of the most reliable seasonal trends in stock sectors is that the retail stocks—especially sub-sectors like Specialty Retail—tend to bottom in August and September, but then rally sharply until Christmas.
Some years, the retail stocks do bottom or top ahead of the typical seasonal pattern. Is this one of those years?
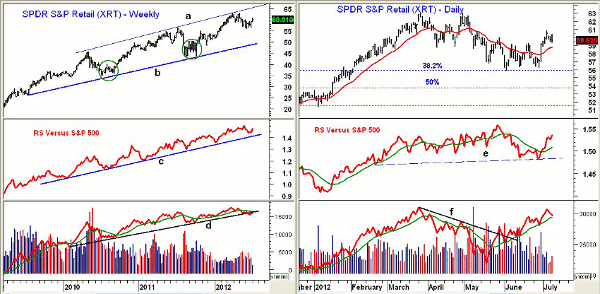
Chart Analysis: The weekly chart of the SPDR S&P Retail ETF (XRT) shows a solid uptrend (line b) that goes back to 2009.
- The chart also shows the summer lows (in green) that XRT formed in 2010 and 2011
- In 2010, XRT bottomed in early July, then retested the lows in August before turning higher
- In 2011, XRT made a low of $43.50 in August, and then in early October hit a low of $43.61 that completed the bottoming process
- The weekly relative performance, or RS analysis shows a long-term uptrend (line b), indicating that XRT has been leading the S&P 500 higher since 2009
- The weekly on-balance volume (OBV) did confirm the May highs, and has now just dropped back below its uptrend (line d) and its WMA
- The upper boundary of the weekly trading channel (line a) is now in the $65.80 area
The daily chart of the SPDR S&P Retail ETF (XRT) shows that it dropped to the 38.2% Fibonacci retracement support at $55.84 in May, then retested the lows in June.
- The more important 50% retracement support is at $53.70
- The daily relative performance line moved strongly above its WMA last week, as support (line e) appears to have held
- The daily OBV broke its downtrend (line f) in late May, and has been acting stronger than prices over the past six weeks
- There is initial support at $58.80 and the rising 20-day EMA, with further levels at $58
NEXT: Key Levels for 2 Major Retailers
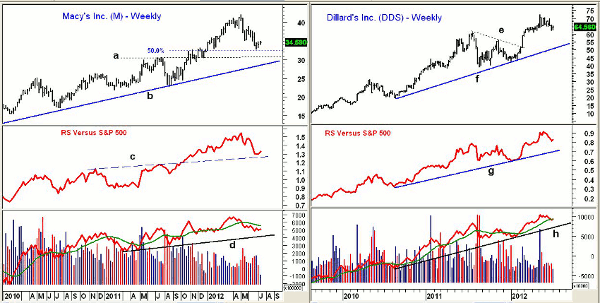
|pagebreak|Macy’s (M) had an impressive rally from last summer’s low of $22.66, hitting a high of $42.17 in early May before its recent correction.
- The late June low was $32.70, which was just above the 50% Fibonacci retracement support at $32.35
- More important support from the July 2011 highs sits in the $30.40 to $30.65 area. The uptrend from the 2009 lows is now at $28.40
- The RS analysis did confirm the May highs, and is now trying to turn up from support (line c)
- The weekly OBV dropped below its WMA three weeks after the May highs, but is still well above support (line d)
- There is initial resistance now at $36, and a close above $38 would be positive
Dillard’s (DDS) is a much smaller ($3.2 versus $14.3 billion) department store that broke out to the upside in February, as it completed its triangle formation by moving through resistance (line e).
- Upside targets from the triangle formation are in the $75 to $77 area
- DDS peaked at $72.46 before the market’s recent correction and appears to be holding the first support around $61 to $63
- The relative performance did confirm the recent highs, and shows a long term uptrend (line g)
- The weekly OBV also made new highs in May, and just crossed back above its WMA last week
- There is long-term OBV support at line h
- There is near-term resistance now in the $68 to $68.50 area
What it Means: The technical action of the SPDR S&P Retail ETF (XRT) and these two department stores suggests they are in the process of bottoming, and may already have. The well-defined support just below the recent lows allows for the risk to be well controlled.
How to Profit: For the SPDR S&P Retail ETF (XRT) go 50% long at $58.86 and 50% long at $58.04, with a stop at $55.44 (risk of approx. 5.1%).
For Macy’s (M), go 50% long at $32.44 and 50% long at $31.46, with a stop at $29.58 (risk of approx. 7.4%).
For Dillards (DDS), go 50% long at $63.94 and 50% long at $62.60, with a stop at $59.47 (risk of approx. 6%).
|pagebreak|


