While the metal's long-term prospects are still very strong, it is unlikely that gold has bottomed in the near term. Also, a recent sharp rally for one gold miner has left it vulnerable to a correction.
From the May 30 low, gold futures rallied over $110 before peaking on Wednesday. The selling on Thursday supposedly reflected the market’s disappointment that Fed Chairman Ben Bernanke was not more forthcoming on a new stimulus plan.
The drop in gold prices over the past six weeks has caused a few of the long-term bulls to alter their near-term outlook. Some are now allowing for a drop as low as $1,200 before the long-term uptrend resumes.
Since early in the year (read 2 Possible Scenarios for Buying GLD), I have been watching gold’s continuation pattern. It still has the characteristics of a pause in gold’s major uptrend. The correction certainly has lasted long enough to discourage many bulls, having been nine months since gold peaked last September.
In 2008, gold peaked in late March, and then did not bottom until the end of October. This seven-month correction took GLD from $100.44 to a low of $66. This was a drop of 34%. An equal percentage drop from the September 2011 high of $185.85 would take GLD to the $122 area.
Though gold’s recent rally was impressive, the daily volume analysis is still not yet indicating that a bottom is in place. For those who are waiting to buy gold, there are some specific levels where I am looking to buy, as I do expect GLD to be significantly higher by the end of the year.
Also, one of the more popular gold miners has reached stronger resistance where some partial profits should be taken.
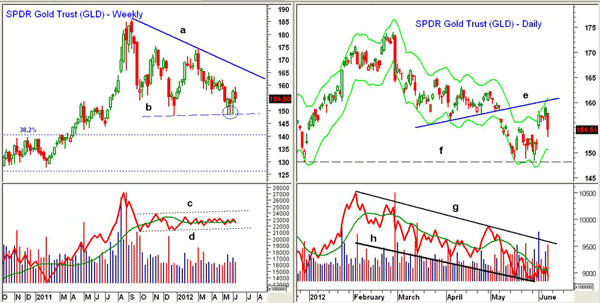
Chart Analysis: The weekly charts of the SPDR Gold Trust (GLD) shows that the December 2011 lows (line b) were tested three times last month. The weekly candle tails (see circle) suggest that the market is well supported below $149.
- This week, GLD reached a high of $159.20, and there is stronger weekly resistance in the $162 to $163.50 area
- The weekly downtrend (line a) is now in the $166.90 area
- The weekly on-balance volume (OBV) is still locked in a eight-month trading range (lines c and d). It needs to move above last November’s highs to confirm a new uptrend
- The monthly OBV (not shown) is still positive for the major trend, and it will turn up with a higher close this month
- If the support (line b) is violated, there is next support at $144, with the major 38.2% Fibonacci support just above $140
The daily chart of the SPDR Gold Trust (GLD) shows that the Starc+ band and chart resistance (line e) were tested this week.
- The recent gap was almost filled Thursday, which is an encouraging sign. Further support sits in the $151 to $152 area
- There is more important support at $148.27 (line f)
- The daily OBV formed lower lows (line h) last week, and has just barely rallied above its declining WMA
- The OBV is further below its downtrend (line g). A move above this resistance would be a positive sign
NEXT: A Mining Stock Too Hot to Continue?
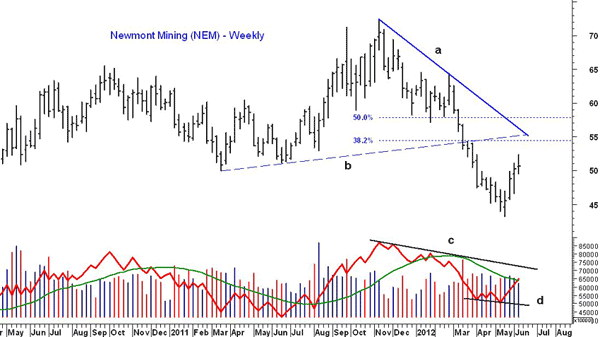
|pagebreak|Newmont Mining (NEM) hit a low on May 16 of $43.23 and hit a high this week of $52.33. A lower close this week is likely to signal a short-term top.
- The weekly chart shows converging resistance in the $54.50 to $55.30 area
- This corresponds to the 38.2% Fibonacci retracement resistance, calculated from the November 2011 highs at $72.42
- The former support is now resistance (line b), with the downtrend (line a) just above $55
- The weekly OBV made lower lows in May (line d), but is now barely above its declining WMA
- There is more important OBV resistance at the downtrend (line c)
- There is next support at $49.50 with more important in the $46.60 area
What it Means: From a seasonal standpoint, gold typically bottoms in late June though late July, then turns higher in August. I would like to see more positive action in the daily OBV to confirm a low, but we may not get it. The evident buying at the recent lows is positive.
I would look to establish longs on a pullback to the lows, with tight stops. Less aggressive investors could wait for confirmation of a low.
If instead prices plunge below the recent lows, we could see a drop down to the $140 to $144 area that would push the bearish sentiment to oversold extremes.
I also recommending taking some partial profits in Newmont Mining (NEM) as it could give up a good part of its gains before it challenges more important resistance.
How to Profit: For SPDR Gold Trust (GLD), go 50% long at $152.42 and 50% long $150.28 with a stop at $147.28 (risk of approx. 2.6%).
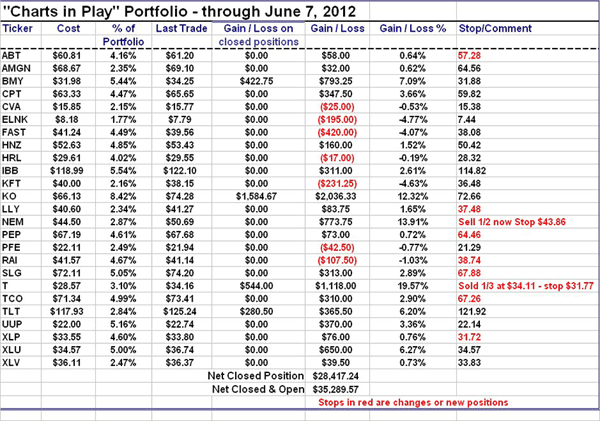
Portfolio Update: The 50% long position in Newmont Mining (NEM) from $44.42 has an open profit of over 14% in less than a month. Sell half now and use a stop at $43.86 on the remaining position.
|pagebreak|


