Positive divergences in some technical indicators suggest rally potential that is largely unexpected, prompting selective new buying in health care stocks and profit taking in a popular inverse ETF.
Global sentiment for stocks early Monday was almost as negative as it was last October with sharply lower trading before the NYSE opening. In early trading, the S&P futures were down over ten points from Friday’s close, but then managed to close the day with just minor losses.
As I noted here last week, not all of the regular sentiment readings are currently negative enough to suggest a major market low, although the financial media has been painting a dire picture.
More importantly, if the positive divergences in many of the technical indicators—especially the market internals—are confirmed, it will favor a rally that is much stronger than the bears expect.
Stock index futures are higher before the opening Wednesday, and confirmation of the positive divergences could occur before the end of the week.
We have been doing some light buying recently and have two new recommendations in the health care sector. We will also look to take some profits on an inverse ETF position.
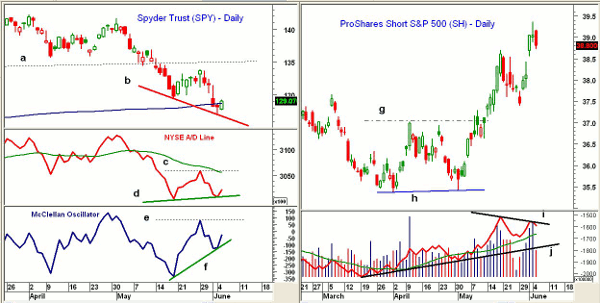
Chart Analysis: The daily chart of the Spyder Trust (SPY) shows a pattern of lower lows, line b. The 38.2% support level at $128.92 was violated last week, as was the still-rising 200-day moving average (MA).
- There is now minor resistance at $130.50 with the 38.2% retracement resistance from the April highs at $133
- A close above last week’s high at $133.93 is needed to reverse the short-term downtrend
- The NYSE Advance/Decline (A/D) line has turned up after forming a positive divergence at Monday’s lows, line d
- A/D line needs to overcome the resistance at line c to confirm this positive divergence
- The McClellan Oscillator had a low of -134 on Monday, which was well above the May 18 low of -335. This bullish divergence, line f, is a positive sign
- A move in the Oscillator above +85, line e, will confirm the positive divergence
- If Monday’s price lows are broken, there is further support at $125.60-$126.50
The double-bottom formation in the ProShares Short S&P 500 ETF (SH) was noted here in early May and was confirmed by the close above resistance at line g.
- The upside target at $38.60 was hit in mid-May, and Monday’s doji high at $39.17 may mark a short-term top
- Declining 200-day MA and further resistance is at $39.88
- Daily on-balance volume (OBV) did not make a new high with prices on Monday, line i. This is consistent with a short-term top
- OBV will have to drop below last week’s low to confirm this negative divergence
- Initial price support is at $38.50 with stronger support at $37.40-$37.80
NEXT: 2 Selective New Buys from the Health Care Sector
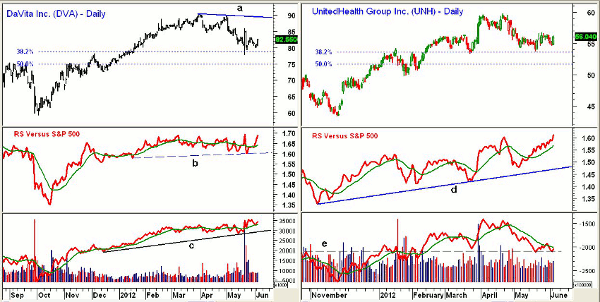
|pagebreak|DaVita Inc. (DVA) is a $7.6 billion provider of kidney dialysis services whose stock dropped as low as $77.81 in late May after announcing a $3.6 billion purchase of a doctor’s group.
- The strong close on Tuesday may complete a short-term bottom with next resistance at $83.05 and further resistance in the $86-$86.50 area
- Major resistance is in the $89.50-$90.50 area, line a
- Daily relative performance, or RS analysis, has been holding firm all year, line b, which is a positive sign
- Daily OBV made new highs last week and has turned up from its weighted moving average (WMA). It has long-term support at line c
- The 38.2% support level was tested last month. The 50% retracement support is in the $75 area
UnitedHealth Group Inc. (UNH) is $58.1 billion health care provider whose daily chart shows a pattern of higher lows.
- 38.2% Fibonacci retracement support at $53.78 (line c) from March and May appears to have held
- 50% retracement support is at $51.70
- RS line made new highs on Tuesday and UNH continues to lead the S&P 500 higher. Good RS support stands at line d
- Since March, UNH is unchanged while the SPY is down 5.8%
- Daily OBV is trying to turn up from good support, line e, but is still below its weighted moving average
- First resistance is now at $56.80-$57.50 with stronger resistance at $59-$59.71
What It Means: The short-term positive divergences, if confirmed, would signal a rally in the Spyder Trust (SPY) back to the $132-$133 level, which is roughly 2.5% above current levels.
Such a rally would likely be part of a more complex intermediate-term bottom formation, and the NYSE A/D line needs to surpass the March and May highs to signal that a new uptrend is underway.
Clearly, the short side is a bit crowded, and the market may get a catalyst to rally from either the Fed’s Beige Book release later today or the upcoming European Central Bank meeting.
A sharply lower close either today or Thursday could abort the bottom formations, however, especially if the A/D ratios were quite negative.
I now recommend selling half of our existing inverse S&P 500 ETF position and would look to buy these two health care stocks as recommended below.
How to Profit: For DaVita Inc. (DVA), go 50% long at $82.22 and 50% long at $81.18 with a stop at $77.58 (risk of approx. 5.0%).
For UnitedHealth Group Inc. (UNH), go 50% long at $55.74 and 50% long at $55.12 with a stop at $52.88 (risk of approx. 4.6%).
Portfolio Update: Buyers should be 50% long the ProShares Short S&P 500 ETF (SH) at $36.26 and 50% long at $36.06. Sell half the position now and raise the stop to $37.38 on the remaining position.


