The recent rebound in gold has many wondering if gold has formed a sustainable bottom concurrent with a short-term top in the US dollar.
With stocks having plunged since early May, the safe haven has been the Treasury market. This has boosted the US dollar, as assets have continued to move out of the euro while Greece's uncertain status has made it the least-favored currency.
The yield on the ten-year Treasury note is at 1.70%, which has completed the continuation pattern, consistent with even lower yields. This follows with the May 9 buy signal in the iShares Barclays 20+ Year Treasury Bond Fund (TLT).
The plunging stock market also caused many to liquidate their positions in gold, and the widely watched SPDR Gold Trust (GLD) dropped to its lowest level since last December. Thursday's sharp rebound in gold and follow-through buying early Friday has some wondering whether the dollar has topped out and if gold has formed a bottom.
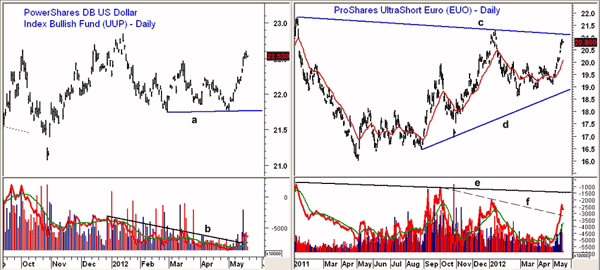
Chart Analysis: The PowerShares DB US Dollar Index Bullish Fund (UUP) retested the February lows, line a, in early May.
- The March highs at $22.47 have been exceeded. Further resistance is at
$22.85 and the January 2012 highs
- The long-term downtrend from the 2008 highs is in the $24 area
- In the past week, the daily on-balance
volume (OBV) has broken its downtrend, line b, as volume spiked on
Monday
- Weekly OBV (not shown) looks better
- There is initial support for UUP in the $22.10-$22.25 area
The ProShares UltraShort Euro (EUO) seeks to provide the performance of twice (200%) the inverse daily performance of the US dollar price of the euro. EUO is up over 9% from the late-April lows at $19.08.
- EUO is now very close to the trend line resistance from the 2011 highs,
line c, in the $21.15 area
- There is further resistance from 2010 in the $22.80-$23.20 area
- OBV has broken through its downtrend, line f, which goes back to last
September's highs. It is well above its weighted moving average (WMA)
- Longer-term OBV resistance stands at line e
- There is first support now at $20.35-$20.50 with the rising 20-day
exponential moving average (EMA) at $20
- The uptrend, line d, is now in the $19 area
NEXT: Has Gold Truly Formed a Bottom?
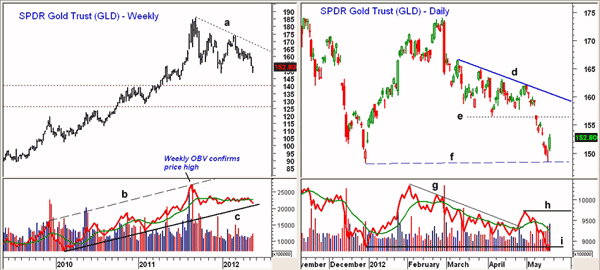
|pagebreak|The weekly chart (left panel) of the SPDR Gold Trust (GLD) shows that the fund is now trading 17.8% below the September highs of $185.85.
- The major 38.2% Fibonacci retracement support, as calculated from the 2008
lows at $66, is at $140
- The 50% retracement support stands at $126.35
- Weekly OBV confirmed the highs last September, which indicates that the
intermediate trend is positive
- OBV made marginal new highs at the end of April before reversing sharply.
It is now below its weighted moving average and approaching the weekly
uptrend, line c
- Major weekly resistance, line a, is now at $168.50
The daily chart (right panel) for GLD shows the sharp drop on May 8 and the break of support at $156.40, line e. This is now an important level of resistance.
- Daily trend line resistance, line d, is now in the $160 area
- Daily OBV had a false breakout in late April when it overcame the
downtrend, line g, before reversing sharply
- OBV did break below the December lows (line i) earlier this week, which is
a sign of weakness
- Volume on Thursday was the highest in almost nine weeks, but the OBV is
still well below its weighted moving average. Key daily OBV resistance is at
line h
- The daily chart shows that the Wednesday low at $148.30 was just above the December low of $148.27, line f
What It Means: In early April, the technical action suggested that the dollar was ready to rally. On a short-term basis, the rally appears to be stalling, yet the intermediate-term outlook suggests an important low is in place.
Nevertheless, I would recommend taking partial profits on leveraged inverse euro positions and watching the next pullback closely.
As for the SPDR Gold Trust (GLD), despite sharp gains on Thursday and Friday's early $15 bounce, the technical evidence of a bottom is not yet very compelling. If an important low is in place, there will be a pullback where the risk on new positions can be better controlled.
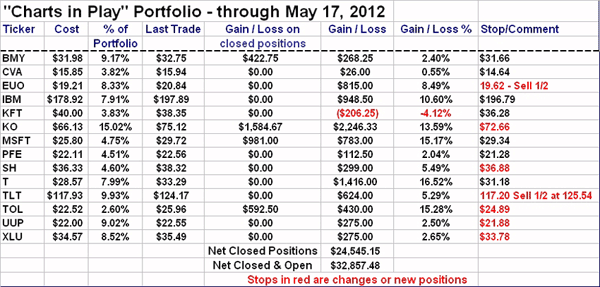
How to Profit: There are no new buy recommendations at this time, but stops should be adjusted on the previously recommended positions (see Portfolio Update below).
Portfolio Update
- For the PowerShares DB US Dollar Index Bullish Fund
(UUP), buyers should be long at $21.98 or better. Raise the stop on that
position to $21.88.
- For the ProShares UltraShort Euro (EUO), buyers should be
long at $19.19 or better. Sell half the position now and use a stop at $19.62
on the remaining position.
- For the SPDR Gold Trust (GLD), the 50% long position from
$160.66 and 50% long position from $158.78 were stopped out at $153.88 for a
loss of 3.7%.
- Buyers should be 50% long Newmont Mining (NEM) at $44.42,
and the second buying level at $42.82 was not hit. Use a stop now at $40.78.
- Cancel any open buy orders in the inverse ETFs
NEXT: View the Complete "Charts in Play" Portfolio
|pagebreak|


