Two popular casino stocks have had hot hands in 2012, and given their positive earnings and business outlooks, the pair is likely to outperform the S&P 500 once the current correction is over.
After a rough five-day slide, stocks stabilized on Wednesday as surprisingly positive earnings from Alcoa Inc. (AA) pushed the stock 7% higher. Most of the major averages closed below their daily Starc-bands on Tuesday, and the short-term McClellan Oscillator was quite oversold at -315. Tuesday’s drop did have some signs of panic liquidation.
Stocks are likely to rebound further over the short term, and the Shanghai Composite was up 1.5% on Thursday ahead of the widely watched GDP report, which is due out on Friday. A more impressive market rally is needed to suggest that the worst of the selling is already over.
Some of the casino stocks are holding up much better than the S&P 500, however, and have been outperforming the overall market since the start of 2012.
Moody’s is predicting a good year for Las Vegas, as the agency expects over 39 million visitors this year. Las Vegas Sands (LVS) and MGM Resorts International (MGM) are the two best-looking stocks in the casino group, and both are scheduled to report earnings in early May.
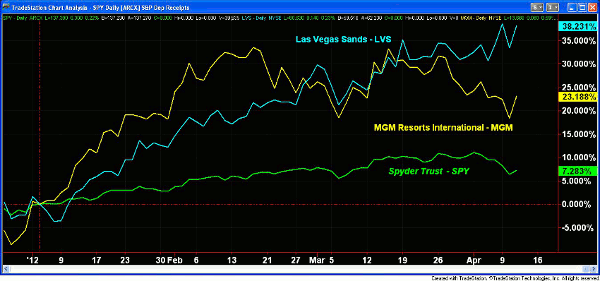
Chart Analysis: The comparative performance, or percentage-change chart, clearly shows how well these two gambling stocks have done in 2012.
- Las Vegas Sands (LVS) was up 3.5% on Wednesday amid heavy volume, and the stock is up almost 36% so far in 2012
- As of Wednesday’s close, the Spyder Trust (SPY) is up only 7.45%, so LVS is outperforming SPY by more than 28% in just over three months
- MGM Resorts International (MGM) has also done much better than the S&P, as it is up 22.4%. This is well below its highest levels, however, as the stock was up by more than 32% in early March
- While MGM is down almost 10% from its highs, SPY has lost only about 4%
NEXT: Key Patterns and Price Levels for These 2 Casino Stocks
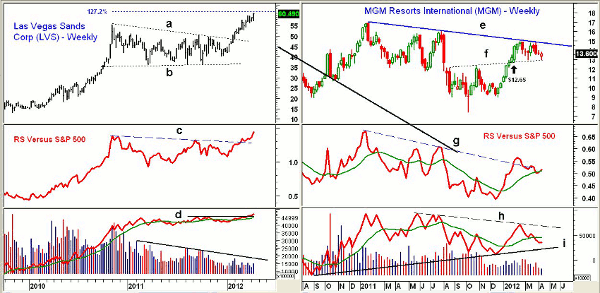
|pagebreak|The weekly chart of Las Vegas Sands (LVS) shows that it completed a major continuation pattern, lines a and b, in late January.
- The 127.2% Fibonacci price-projection target at $61.80 has almost been reached
- The width of the flag formation has upside targets in the $67-$69 area
- The relative performance, or RS analysis, has also broken through major resistance at line c, suggesting that LVS will continue to outperform the S&P 500
- Though the volume has been declining since early 2011, the on-balance volume (OBV) indicates that LVS is being accumulated because OBV has broken through resistance at line d
- LVS has minor support at $58-$59 with stronger support now at $56.50
- There is good monthly chart support in the $50.50-$52.50 area
MGM Resorts International (MGM) rallied to a high of $14.94 in February and again tested the long-term downtrend, line e, in late Mach. The sideways pattern over the past three months could be a double top, but it is more than likely a continuation pattern instead.
- On a strong close above $15, the next major resistance from 2011 is at $16.94
- MGM peaked in October 2007 at $100.50, and the major 38.2% resistance is now just below $40
- MGM has very good support at line f, and the late-January low is at $12.65
- Weekly relative performance broke its downtrend, line g, in early January and is now testing its weighted moving average (WMA)
- A strong close in the RS line within the next week or so would support the bullish case
- Weekly OBV failed to move through its long-term downtrend, line h, in February, and it is now back below its weighted moving average
- There is good weekly OBV support at the uptrend, line i. The daily OBV (not shown) is still negative
- There is initial support now at $13-$13.20 with stronger support at the October 2011 high of $12.41
What It Means: The long-term price action in Las Vegas Sands (LVS) indicates that after the current market correction is over, it is likely to continue to lead the S&P 500 higher.
The chart of MGM Resorts International (MGM) also looks quite interesting, as the major support levels can be well identified. I will be watching for a move in the weekly OBV back above its weighted moving average to turn the outlook for the stock more positive.
How to Profit: There are no clear signs that the broad market correction is over, and the Spyder Trust (SPY) is likely to have trouble overcoming the chart and retracement resistance in the $138.20-$139 area.
For Las Vegas Sands (LVS), watch for a pullback to the $52.50-$53.50 area.
NEXT: View the Updated “Charts in Play” Portfolio
|pagebreak|


