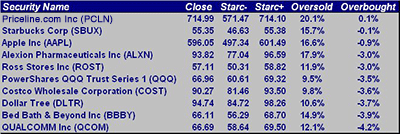
Close proximity to technically overbought levels makes these strong Nasdaq 100 performers high-risk buys at current levels, but potentially appealing on an upcoming correction.
The PowerShares QQQ Trust (QQQ) was up 1.75% on Monday and was the strongest market segment other than the small-cap S&P 600, which was up 2.03%. The market internals were strong and supported the price gains.
New comments from Fed chairman Ben Bernanke boosted stocks, but as I mentioned last week, end-of-quarter window dressing from fund managers was likely a factor as well. This may help support stocks for the rest of the week, though many are wondering whether this week’s new economic data will dampen the enthusiasm.
Despite the positive technical readings and improving outlook for the economy, I do not think this is a time to relax when it comes to managing your stock positions. One of the scans that I run each week is intended to show where my stock holdings are trading relative to their weekly Starc bands. I often determine profit-taking levels from these bands.
For more on trading with Starc bands, click here.
Starc band analysis gives a reading of whether a stock is a high- or low-risk buy at the time. Close proximity to the upper Starc band (Starc+) means risk is high since the stock is likely to at least move sideways, if not decline. This is also one way to measure whether a stock is overbought or oversold.
The table below shows the ten Nasdaq 100 stocks that are closest to their weekly Starc+ bands. As of last Friday, the PowerShares QQQ Trust (QQQ) was just 3.5% below its weekly Starc+ band, but after Monday’s gain, it is now just 1.7% below it. Of course, Apple (AAPL) is on the list, as it has traded above its monthly Starc+ band for the past two months (see chart).
The last time QQQ was this close to its weekly Starc+ band was on July 8, 2011, when it closed just 0.7% below the band. The fund subsequently moved sideways for four weeks before dropping sharply.
Though the technical readings for the stock market are currently much stronger than they were in July, I still would recommend that anyone long any of these stocks look to sell part of their positions on the current strength.
NEXT: Nasdaq 100’s Most Overbought Stocks
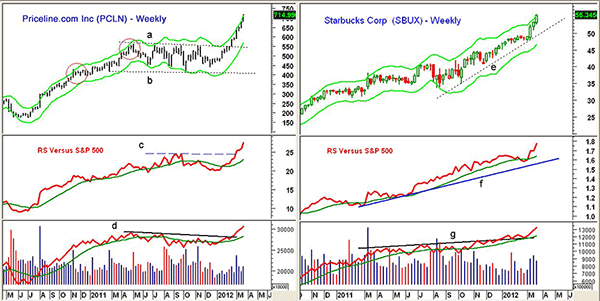
|pagebreak|Chart Analysis: Priceline.com Inc. (PCLN) broke out of its year-long trading range (lines a and b) in the middle of February. This is very positive for the intermediate term, and PCLN was the only Nasdaq 100 stock to close last week above its weekly Starc+ band.
- The width of the trading range has an upside target at $680-$690, which has already been exceeded
- PCLN has been testing the weekly Starc+ band for the past four weeks
- On the chart, I have highlighted two times in 2011 when the weekly Starc+ band was tested. In early 2011, prices moved sideways for seven weeks before moving higher, while last summer, there was a sharper correction
- The relative performance, or RS analysis, also broke out in February, as resistance at line c was overcome. This suggests PCLN will continue to be a market leader
- Weekly on-balance volume (OBV) also confirmed the price action, as it surpassed resistance, line d, and has confirmed the new highs
- There is now first support in the $700-$710 area with stronger support at $650
Starbucks Corp. (SBUX) is up almost 15% this month, having closed last week just barely below its weekly Starc+ band. With the stock making new all-time highs, further upside targets are tough to determine.
- Monday’s close at $55.91 was above the weekly Starc+ band at $55.38
- The RS line has confirmed the price action and has turned up sharply. It is well above long-term support at line f
- The volume has been strong over the past three weeks, which has moved the OBV further above its rising weighted moving average (WMA) and support at line g
- There is first support now at $51.50-$53 with more important in the $46-$48 area
NEXT: One Strong Performer Could Be Forming a Top
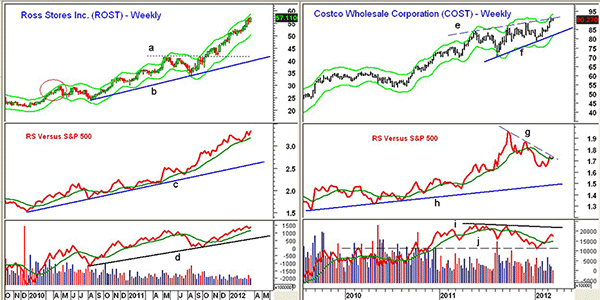
|pagebreak|Ross Stores Inc. (ROST) has been one of the strongest stocks since last summer when it dropped to a low of $33.50. It has been trading near its weekly Starc+ band for the past three weeks.
- ROST was up almost 3% on Monday and is now just a few cents below its Starc+ band
- The RS line has been in a solid uptrend since early 2010, line c, indicating it was a market leader
- Weekly OBV moved back above its weighted moving average last October and has confirmed the price action, but it is not rising as sharply as prices
- There is minor support in the $55-$56.50 area with next good support at $52
Costco Wholesale Corporation (COST) it just testing trend line resistance (line e) in the $91.50 area with the Starc+ band this week at $93.50.
- The weekly chart shows a potential rising wedge formation, lines e and f
- The RS line peaked in September and has been diverging since forming lower highs, line g
- It is trying to move back above its weighted moving average and is still well above long-term support at line h
- Weekly OBV did not confirm last fall’s highs, line i, and has continued to act weaker than prices
- Stronger support at line j was tested late last year, and a drop below this level would be negative
- There is initial support now at $88 with further support in the $85-$86 area
What It Means: The current weekly analysis only looks toppy for Costco, while the other three stocks still look technically positive. All are clearly overextended, as they are 5%-10% above first good chart support.
A drop back to these support levels would not be surprising, therefore, those long any of these stocks should have a plan in place, and anyone holding all of their original positions should take some profits on the current market strength.
How to Profit: I previously recommended taking profits on half the position in the PowerShares QQQ Trust (QQQ) and will look to close out the rest of that position when there are clear signs of a short-term top.
The positive relative performance analysis makes Priceline.com Inc. (PCLN), Ross Stores Inc. (ROST), and Starbucks Corp. (SBUX) all worth watching on any corrections.


