It seems that Thursday’s big declines in Safeway (SWY), American Electric Power (AEP), and Hewlett Packard (HPQ) were all preceded by clear technical warning signals.
There have been quite a few stocks that have dropped sharply while the overall market has moved higher this month. One of the most dramatic was Gilead Sciences (GILD), which was featured in an early-February column entitled “3 Stocks You Shouldn’t Buy Now.”
GILD has dropped from a high of $56.50 to a low this week of $43.81. It had closed well above its weekly Starc+ band in early February but is now close to the weekly Starc- band. (Learn more about trading with Starc bands here.)
Three big-name stocks dropped sharply Thursday on heavy volume, as they were hit either by poor earnings or bad news. All three flashed warning signs before they dropped, however, so let’s take a closer look.
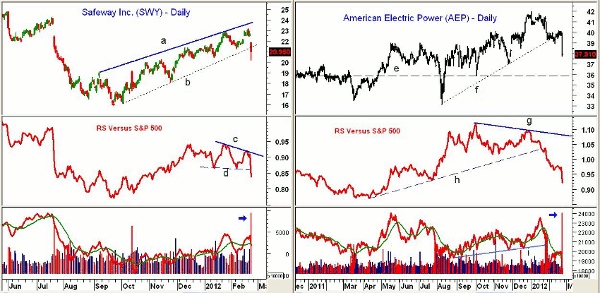
Chart Analysis: Safeway Inc. (SWY) reported that its profits dropped 6% in the fourth quarter as higher fuel and commodity prices hurt the bottom line.
- The stock closed down 7.6% and below the uptrend, line b, on over twice the average volume
- There is next good support in the $19.50 area with the 61.8% Fibonacci retracement support at $18.60
- The RS line formed a negative divergence at the recent highs (line c) and has now broken support at line d
- The on-balance volume (OBV) did not make new highs last week and has dropped back below its weighted moving average (WMA)
- There is initial resistance now at $21.20-$21.60
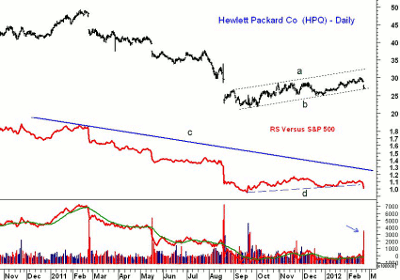
American Electric Power (AEP) was down 4.8% on Thursday as a rate settlement agreement was rejected by the Public Utilities Commission of Ohio. Volume of 21 million shares was over four times the daily average. AEP pays a yearly dividend of $1.88 for a current yield of 4.8%.
- The uptrend from last summer’s lows, line f, was broken on a closing basis in early February
- There is next support at $36.50-$37 with stronger support at $35.80, line e
- The RS line completed its three-month negative divergence (line g) in late January when it dropped below support at line h
- Daily OBV had also broken support, line i, well ahead of prices. The volume action suggested liquidation well before the new hit
- Strong resistance now stands in the $39-$39.50 area
NEXT: Warning Signs Preceded Hewlett Packard’s Big Decline
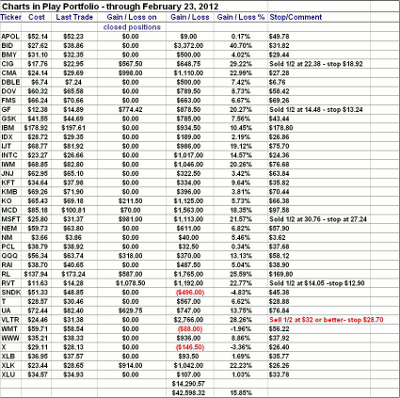
|pagebreak|Hewlett Packard Co (HPQ) opened down $1.24 on Thursday and closed near the lows at $27.05. Volume at over 71 million shares was more than four times the daily average.
- The daily chart suggests that the entire rally from last summer’s lows is just a continuation or flag pattern (lines a and b)
- The 127.2% Fibonacci price target is in the $19.20 area
- The relative performance, or RS analysis, has been in a long-term downtrend (line c) and has formed lower lows
- The RS line has been weaker than prices since September and has now broken support, line d
- OBV failed to rally as HPQ edged higher and dropped below its weighted moving average earlier in the week
What It Means: Though I sometimes recommend stocks for which the RS analysis has not yet completed a bottom, I try to avoid those where the RS is giving stronger warning signals.
It is also important to remember that even in a strong market, not all stocks go up, so you must be selective.
How to Profit: All three stocks look as though they will drop further over the coming weeks. AEP would yield over 5% on a drop below $36 per share, however, and that makes it a stock to watch.
NEXT: View the Complete Charts in Play Portfolio
|pagebreak|


