Once out-of-favor homebuilding stocks have been on a torrid run, but seasonal weakness and extreme bullishness are likely to produce a correction and more favorable entry points for patient investors.
In the first few weeks of 2012, there have been a large number of articles and headlines discussing the homebuilding stocks. The positive news on the housing sector so far in 2012 has turned even more analysts and investors bullish on this sector. Does that mean you should be buying now?
Clearly, sector selection was the key in 2011, and it should also be a key factor in your stock selection in 2012. From a technical standpoint, the homebuilders have had an impressive run since their volume surge in mid-October.
The strong action over the past two weeks has taken many homebuilding stocks close to strong resistance, and while there are no clear signs yet of a short-term top, one is increasingly likely in the next week or so.
The seasonal analysis of the homebuilding stocks indicates that they often correct during February, as I’ll discuss below. Even more worrisome is the high degree of bullish sentiment, which suggests current shareholders should be looking to take profits on their positions and then wait for a decent correction to re-buy.
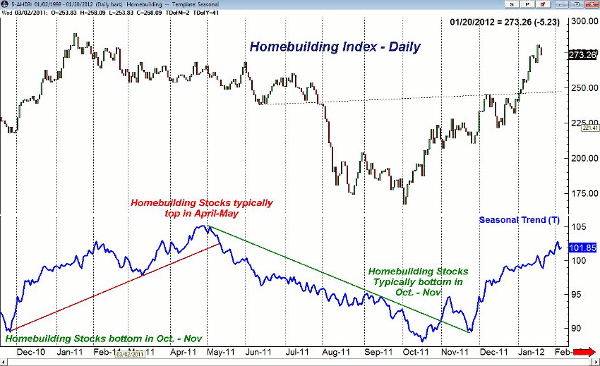
Chart Analysis: This chart of the homebuilding index analyzes data going back to 1998. Typically, the homebuilding stocks bottom in October and November, and you can see that the seasonal downtrend (line c) is broken during the latter part of October and then often retested in November before the uptrend is clearly established.
- This pattern fits this year’s action quite well, as there was a sharp pullback in this industry group the week of Thanksgiving before the homebuilding stocks accelerated to the upside
- On a short-term basis, you can see that the seasonal trend line turns lower during February and often bottoms out in the early part of March before the uptrend resumes
- Typically, the homebuilders will complete a major top in late April or early May and then decline during the summer months
- For this index, the next strong support level is in the 245 area, line a, which is about 10% below current levels
- The industry group has further resistance from early 2011 in the 290 area and then more important resistance in the 320-350 area
- The index had a high of 1063 in May 2005, so the major 38.2% retracement resistance is well above current levels and in the 490 area
NEXT: The Strongest Chart of All the Homebuilders
|pagebreak|
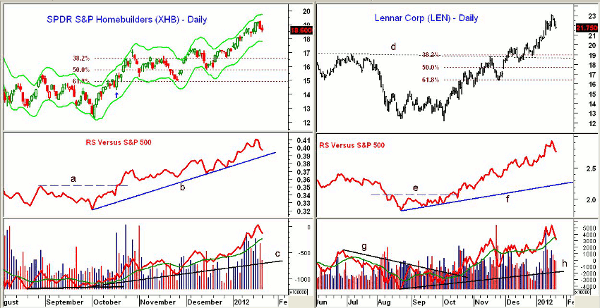
The SPDR S&P Homebuilders ETF (XHB) hit a low of $12.21 in October and recently hit a high of $19 30. The high for XHB in 2010 was in the $20 area. XHB has longer term resistance in the $24.40 to $25.00 area.
- XHB reversed last Friday after approaching its daily Starc+ band. The daily Starc- band is currently at $17.78
- The 38.2% Fibonacci retracement resistance is at $16.60 with the 50% resistance at $15.75. These of course are calculated from last week’s highs and would need to be adjusted if XHB makes further highs in the next week or two
- The relative performance, or RS analysis, completed its bottom formation in October when it moved through resistance at line a. It is now in a strong uptrend, line b, but has turned lower
- The on-balance volume (OBV) formed a positive divergence at the October lows and is now in a solid uptrend, line c. It is still well above its rising weighted moving average (WMA)
- The weekly OBV (not shown) has surpassed the early-2011 highs as well as the highs from 2010 and is acting stronger than prices. The weekly Starc+ band is at $19.84
Lennar Corp. (LEN) has one of the strongest charts of all the homebuilders and appears to have very strong fundamentals. I recommended buying LEN several times since last fall, but unfortunately, the buy levels were never hit. It will once again be a prime buy candidate on a correction.
- From a low of $12.14 in October, LEN hit a high of $20.93 last week. This is quite close to the early-2011 high of $21.27. In 2010, LEN traded as high as $21.79
- LEN tested its weekly Starc+ band last week before turning lower
- There is converging support for LEN in the $18.70-$19 area. This corresponds to chart support at line d as well as the 38.2% retracement support from the October lows at $12.14. The 50% support is now at $17.70
- The RS analysis completed its bottom formation in October, moving through resistance at line e. Though it turned down last week, it is well above long-term support at line f
- The daily OBV formed a positive divergence at the October lows, line h, and is currently well above the support level. The break of the downtrend in the OBV, line g, was a very positive sign
- As was the case with XHB, the weekly technical studies are also very strong
What It Means: While it is possible that the overall decline in the stock market will not be overly severe, I do think some of the very strong sectors— including homebuilders—are overdue for meaningful corrections.
Such a correction should provide a good buying opportunity, but given the close proximity to more important resistance, buying at current levels does not seem wise. Therefore, I recommend taking at least partial profits on further strength and tightening stop levels.
How to Profit: For Lennar Corp. (LEN), go 50% long at $18.78 and 50% long at $18.32 with a stop at $16.16 (risk of approx. 12.4%).
Buyers should now be 50% long the SPDR S&P Homebuilders ETF (XHB) from October 15 at $15.28. As recommended, half the position would have been sold on January 3 at $17.46. Use a stop on the remaining position at $17.96 and sell at $19.44 or better.
Buyers should also be long KB Home (KBH) at $7.05 from October 31. The stock is currently up over 27%. Raise the stop to $7.88 and sell half the position at $9.90 or better.
Cancel any other open orders in the homebuilders.
Those interested in learning more about relative performance analysis should attend my upcoming workshops.


