Their surprising 2011 outperformance has left many big Dow stocks close to overbought conditions, but several strong performers still look to have further upside potential ahead.
The disparity in the performance of the major averages in 2011 was unusually pronounced, as the Dow Industrials gained 5.5%, while the S&P 500 was flat and the Nasdaq Composite was down 2.2% for the year.
This does not typically occur, as seen in 2010, when the Dow was up 1%, the S&P 500 gained 12.7%, and the Nasdaq Composite led the pack, up 16.8%. Plunging bond yields in 2011 were behind the Dow’s gain, as generally higher yields of Dow stocks made them more attractive buys for investors.
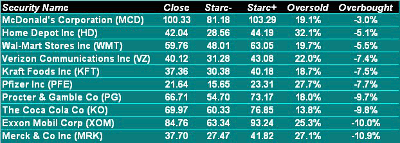
Given the strong performance of the Dow Industrials, it is not surprising that many of the Dow stocks were relatively close to their monthly Starc+ bands at the end of the year. I have found that the proximity of a stock’s monthly closing price to its Starc bands is one of the most reliable ways to identify overbought and oversold stocks.
It should be no surprise that McDonald’s Corp. (MCD) which had a stellar gain of 30.7% in 2011 is the most overbought stock, as its yearly closing price is just 3% below the monthly Starc+ band.
In contrast, the tenth stock on the list, Merck & Co. Inc. (MRK), is 10.4% below its monthly Starc+ band. The monthly analysis also reveals two stocks that could be the star performers in 2012.
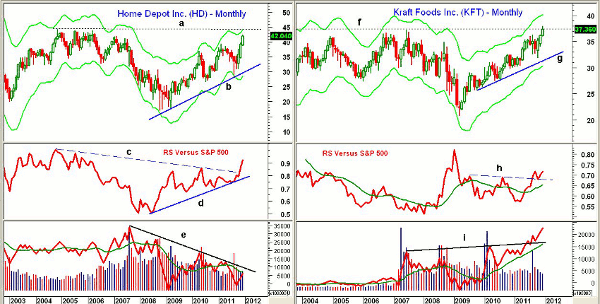
Chart Analysis: Home Depot Inc. (HD) was able to surpass its 2007 highs in 2011 and has next strong resistance at $44.26, which corresponds to the monthly Starc+ band. It is still well below the 2000 high of $70 and pays a current yield of 2.8%.
- First support is at $41 with further support in the $39-$40 area
- The 38.2% support from the 2011 lows is at $37
- The relative performance, or RS analysis, overcame its long-term downtrend, line c, at the end of October. This signaled that it was outperforming the S&P 500, a trend that should continue into 2012
- Monthly on-balance volume (OBV) is still below its long-term downtrend, line e, while the weekly OBV (not shown) is more positive
Kraft Foods Inc. (KFT) was included in last month’s list of oversold Dow stocks. It has a current yield of 3.1%.
- KFT closed at the highs of past seven years with the monthly Starc+ band at $40.18. The stock made a high in 2002 at $43.95
- RS analysis completed a monthly bottom formation when it surpassed the resistance at line h at the end of August
- Monthly OBV also broke through resistance last summer (line i) and is acting very strong
- KFT has first good support in the $36.20-$36.50 area with more important support at $34.50
- The monthly uptrend (line g) is now at $31.50
NEXT: Latest Charts for Pfizer and Exxon Mobil
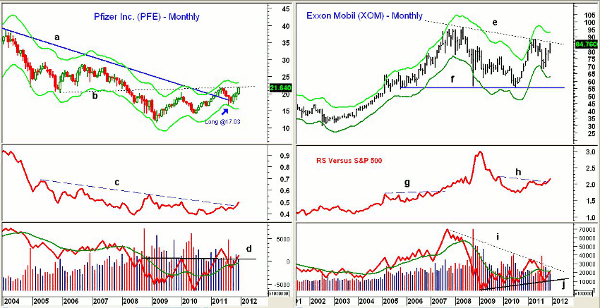
|pagebreak|Pfizer Inc. (PFE) closed 2011 above the early-2011 highs at $21.45. The downtrend from the 2000 highs was broken at the end of March 2011. Despite the recent rise, the stock still yields 3.7%.
- The monthly chart shows that the resistance at current levels is quite strong (line b), and the weekly Starc+ band is at $22.50 with the monthly Starc+ band at $23.31
- RS analysis has just broken its long-term downtrend, line e
- Monthly OBV overcame long-term resistance in early 2011 (line d) and has just moved back above it
- There is minor support at $21 with stronger support in the $19.80-$20.30 area
- The 61.8% retracement resistance from the August 2011 lows is at $18.69
Exxon Mobil Corp. (XOM) is not far below its major downtrend (line e) and the 2011 highs at $88.23. The highs in 2009 were at $96.12. The current yield is 2.2%.
- The monthly flag formation, lines e and f, has bullish long-term implications
- A completion of the triangle would give upside Fibonacci targets in the $103 area
- RS analysis has just moved through short-term resistance at line h, which is a positive sign
- A similar breakout in 2007 (line g) preceded a sharp move to the upside
- The monthly OBV is just slightly above its weighted moving average (WMA) and has good support at line j. A move through the long-term downtrend, line i, would be very positive
- Initial support stands at $82-$82.60 with stronger support at $80.50
What It Means: This regular monthly analysis of the Dow stocks highlights the most overbought or oversold stocks, however, longer-term analysis can be quite valuable, as has been the case with Pfizer.
Often times, the most overbought stocks also are the ones that are outperforming the S&P 500 (positive RS analysis), as was the case with McDonald’s Corp. (MCD). RS analysis can often identify the year’s star performers (see “The Year’s Most Reliable Indicator”).
How to Profit: As noted below, I have had previous recommendations in Pfizer Inc. (PFE) and Kraft Foods (KFT), and now have two new recommendations:
- For Home Depot Inc. (HD), go 50% long at $40.04 and 50% long at $37.44 with a stop at $35.12 (risk of approx. 9.2%).
- For Exxon Mobil Corp. (XOM), go 50% long at $82.28 and 50% long at $80.68 with a stop at $73.74 (risk of approx. 9.4%).
Portfolio Update
- For Pfizer Inc. (PFE), as previously recommended, buyers should be long at $17.03. Raise the stop to $17.88.
- For Kraft Foods (KFT), buyers should be 50% long at $34.54 and using a stop at $33.52.
- For International Business Machines (IBM), buyers should be 50% long at $178.72 with a stop at $174.32.
- For Intel (INTC), buyers should be 50% long at $23.24 with a stop at $22.34.
- For Coca-Cola Co. (KO), buyers should be long at $66.24 or better with a stop at $64.22.
- For Johnson & Johnson (JNJ), buyers should be long at $62.88 with a stop at $61.74.
- For AT&T Inc. (T), buyers should be long at $28.54 with a stop at $28.22.


