In a year that saw stunning underperformance by some big-name stocks and had many surprise winners, one indicator proved most useful for buying strength and avoiding big losers.
No matter what happens in the last few days of the trading year, it has been an especially rough one for stock investors. While the S&P 500 is still down for the year, the Dow Industrials are actually up almost 5% (at time of writing).
So how could investors have known to be in the SPDR Diamond Trust (DIA), which tracks the Dow, instead of the Spyder Trust (SPY), which tracks the S&P 500?
In addition, buying the big US or foreign money center banks was also a horrible idea in 2011, with Bank of America (BAC) down 57% so far for the year. But there were some bright spots, including McDonald’s (MCD), up 29.7%, or Southern Co. (SO), which was up 13.7% in the last half of the year, not including dividends (SO yields 4.1%).
There was one indicator that could have helped investors to avoid the losers and spot the winners: the relative performance, or RS analysis. These examples will show why.
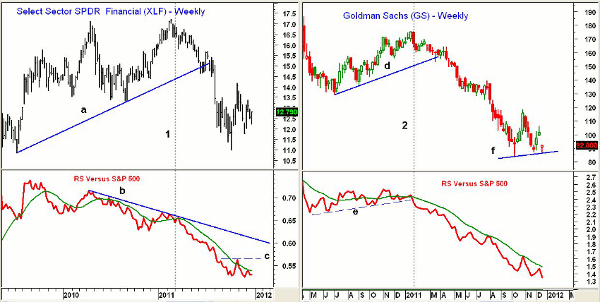
The Select Sector SPDR - Financial (XLF) is down just over 19% so far this year, as it peaked at $17.20 in the middle of February.
- XLF closed below the weekly uptrend, line a, in early June, which was a negative sign
- The weekly RS line started forming lower lows in 2010, and another new short-term downtrend began in early March (line 1)
- The RS shows a long-term downtrend (line b), and for the most part, it has stayed below its declining weighted moving average (WMA)
- The RS needs to move above resistance at line c to suggest it is bottoming
Goldman Sachs (GS) has fared even worse this year, as it is down 45.7% after peaking in January at $175.34. It was selected in May as one of “The 4 Worst Bank Stocks.”
- GS had a low at $84.20 recently and has come close to testing the lows this week
- The weekly chart shows that its uptrend, line d, was violated in the middle of April
- The RS line broke support, line e, on January 22 (line 2) and has since been in a well-established downtrend. It has stayed below its weighted moving average
- Though the chart is trying to form a double-bottom formation, this is not supported by the RS analysis
- GS needs to move above the prior weekly high at $118 to signal a new uptrend has begun
NEXT: How RS Analysis Spotted the Year’s Big Winners
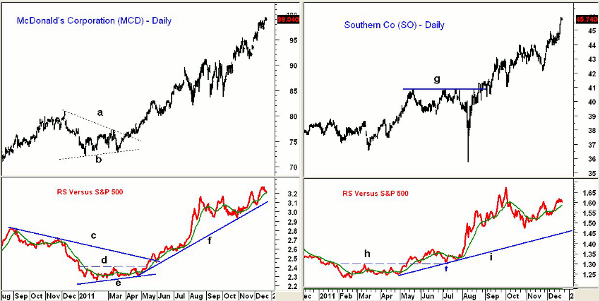
|pagebreak|McDonald’s Corp. (MCD) has been a favorite since April and has accelerated to the upside over the past few weeks, coming close to the weekly Starc+ band at $101.50.
- MCD broke out of a flag formation (lines a and b) in early April, suggesting that its uptrend had resumed
- The daily RS analysis bottomed out during the spring, lines d and e, and completed the bottom in May when the long-term downtrend, line c, was overcome
- RS is still in a strong uptrend
- There is minor support now at $97 with stronger support in the $95 area
Southern Company (SO) hit a low of $42.11 in November and just closed at $45.86. The stock was hit very hard during the August panic selling, which in hindsight was a great buying opportunity. The strong action of the RS analysis at the time indicated it was still outperforming the overall market.
- The strong daily resistance at $40.87 (line g) was overcome on August 23 and SO has not looked back since
- The daily RS line completed its bottom formation on May 11 when the resistance at line h was overcome
- The breakout level was tested in July before the RS line again turned higher
- The RS line is still in a strong uptrend, line i, but has not yet surpassed the early-October highs
- There is good support now in the $44 area
What It Means: In many of this year’s Charts in Play articles, I have shown how the RS analysis can help identify the winners and losers. By combining it with the on-balance volume (OBV), traders and investors can get further confirmation.
How to Profit: Next time you are looking to buy a stock or ETF, see how it is performing against the S&P 500 by running similar analysis on many free Web sites. Option traders can also use the RS analysis in their directional option strategies.
This will be last Charts in Play feature until December 27—happy holidays!
Related Reading:


