Utilities, consumer staples, health care, and consumer discretionary have fared best this year, but a warning sign has emerged for one, calling into question which sector ETFs will outperform in 2012.
The S&P 500 closed Monday at 1257.09, just a fraction below 1257.64, which was where it closed on December 31, 2010. Clearly, a buy-and-hold strategy on the S&P 500 has not worked well this year, but performance is always relative.
Those who bought and held the Select Sector SPDR - Financial (XLF) are feeling much worse, as it is currently down 17.4% for the year. Looking at the quarterly performance of the nine major Select Sector SPDR ETFs, you get even a better feeling for how difficult the past year has been.
The Select Sector SPDR - Energy (XLE) has had the two best quarters so far this year, but the fund also lost 22.3% in the third quarter. The Select Sector SPDR - Industrial (XLI) and the Select Sector SPDR - Materials (XLB) also had a rough third quarter after both turned technically negative in May (see “2 Key Sectors Top Out”).
All three have since rebounded nicely this quarter and will be the sectors to watch as we start 2012. In particular, we will be watching the energy sector, as crude oil typically forms a seasonal low in February.
See related: The 4 Key Seasonal Trends for 2012
The four top-performing sectors have been favored since early in the year because of their positive relative performance, or RS analysis, versus the S&P 500, as well as their chart and volume analysis. By looking at both the weekly and daily data, we can get a better idea of the intermediate- and short-term RS trends.
While all four ETFs outperformed the S&P 500, one needs to be watched closely going forwards, as it may be topping out.
NEXT: Defensive Sectors That Fared Best This Year
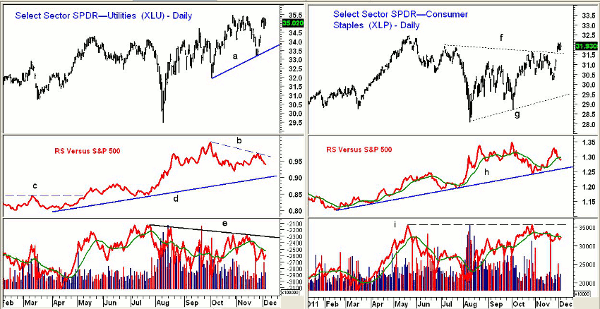
|pagebreak|Chart Analysis: The Select Sector SPDR - Utilities (XLU) has rebounded back to the year’s highs at $35.46 after dropping briefly below the $33.50 level in late November. The fund is currently up 11.7% for the year.
- The next upside targets for XLU are in the $36-$36.50 area
- RS analysis bottomed in May when it overcame resistance at line c. It is still in a well-defined uptrend (line d) but has formed lower highs
- A drop in the RS below the October lows would be a sign of weakness
- Daily on-balance volume (OBV) is negative and has formed lower highs as the volume on the August decline was quite heavy
- Weekly OBV (not shown) is still positive
- There is now support at $33.50-$34, and a daily close below $33.18 would be negative
The Select Sector SPDR - Consumer Staples (XLP), though considered a defensive sector, is the only sector ETF that has broken out to the upside in the past week, as it gapped through resistance at line f.
- XLP had a high in May of $32.46, while the recent trading range (lines f and g) has targets in the $33.50-$34 area
- Daily RS analysis has been positive since early in the year and tested its uptrend, line h, last month. It has not yet moved above the October highs, but is still in an uptrend
- Daily OBV was a bit stronger than prices in October, but it has not yet confirmed the price action
- Weekly OBV, as noted in September, continues to act stronger than prices
- Initial support now stands at the gap in the $30.89-$31.62 area with stronger support at $30.20
NEXT: Red Flag for One of 2011’s Top-Performing Sectors
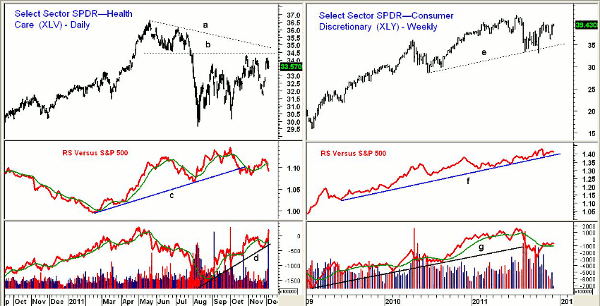
|pagebreak|The Select Sector SPDR - Health Care (XLV) has posted a 6.6% gain so far this year, but the daily chart shows strong converging resistance in the $34.50-$35 area. XLV had a high of $36.01 in July and $36.57 in May.
- Daily RS analysis violated its uptrend, line c, in October, and has dropped below its weighted moving average (WMA). A convincing break below the November lows would start a new downtrend
- Daily OBV rose sharply on Monday amid very heavy volume. The OBV shows a steep uptrend, line d, and is acting stronger than prices
- Weekly OBV (not shown) is rising and well above its weighted moving average
- There is first support for XLV at $33 and a close below $31.60 would be a sign of weakness
The weekly chart for the Select Sector SPDR - Consumer Discretionary (XLY) shows that good support (line e) was tested in August and October. This sector is up over 13% so far in the fourth quarter and has benefited from the strong seasonal period for the retail sector.
- Last week’s strong close suggests XLY could surpass the recent highs at $40.17, which would signal a test of the July highs at $41.79
- The weekly RS shows a pattern of higher highs and higher lows since 2009
- The weekly OBV violated its uptrend, line g, in August, on heavy volume
- The OBV is back above its flat weighted moving average, but volume has been low over the past few weeks
- There is initial support at $37.70-$38.30 with key support now at $36.33
What It Means. Of the four favorite sector ETFs, it is the action in the Select Sector SPDR - Health Care (XLV) that is starting to raise warning flags. Also, the action in the Select Sector SPDR - Technology (XLK) has been disappointing, as it has been weaker than expected since the October lows. The long-term RS analysis is positive for technology, while the daily analysis is not.
If the global economy is going to turn the corner in 2012, then the materials and industrials should do well. The next correction in these sectors may present a good buying opportunity in the ETFs that track them.
How to Profit: As recommended in mid-August, investors should be 50% long the Select Sector SPDR - Consumer Staples (XLP) at $29.08 and 50% long at $28.88. Raise the stop on that position from $27.96 to $29.92 at this time.
Also, buyers should be 50% long the Select Sector SPDR - Technology (XLK) at $23.66 and 50% long at $23.12. Raise the stop on that position from $21.74 to $23.88.


