Among the factors that could push stocks higher in the weeks ahead is a flow of assets from losing bond funds into stronger equities.
Asset manager Legg Mason surprised many yesterday when the company reported that their fixed income funds had outflows of $8.6 billion in the three months ending September 30. Yields have increased from the September lows, as the yield on the ten-year note has risen from a low of 1.69% to 2.39% on Thursday.
Long-term yields have also risen; the yield on the 30-year Treasury bond has moved from a low of 2.69% to 3.45%, an increase of over 28%. The rush into the bond market early in the year was quite dramatic and MIT had no trouble selling 100-year bonds. While concerns regarding a double-dip recession grew, investors became satisfied with almost no yield as long as their principal was safe.
There are now signs that the interest rate futures have completed weekly top formations, as the daily analysis is clearly negative. Bond fund investors have seen the value of their funds drop as yields move higher, but when their capital loss greatly exceeds the yields they are obtaining, will they finally move back into stocks?
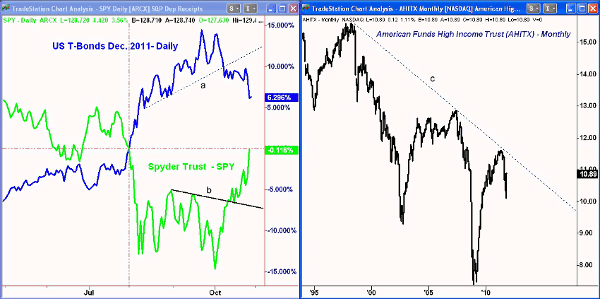
Chart Analysis: The percent-change chart is calculated from the start of August 2011. Therefore, it shows that the December 2011 T-bond contract was up almost 15% in September but is now up only 6.29%.
- The support on the T-bond chart, line a, was broken on October 7, which completed a double-top formation
- This suggests that any rebound in T-bonds is likely to be just a pause in the downtrend
- The Spyder Trust (SPY) broke out to the upside on October 13 almost a week after the bonds broke support
- SPY is just back to the unchanged line relative to the start of August
- Both charts suggest that their current trends can continue
The American Funds High Income Trust (AHITX) is a $16 billion high-yield bond fund that currently yields 8.54%. Its secondary goal is capital appreciation and it invests in lower-quality debt.
- The monthly chart shows a downtrend, line c, going back to 1998
- The downtrend was tested at the end of April 2011 when AHITX closed at $11.58
- In July, the fund traded as high as $11.45 but dropped to a low of $10.11 in early October before rebounding to $10.89
- The 200-day moving average is at $11.35. For those who bought at $11.35, their yield would be 7.6% (using their current monthly dividend)
- At the current price, those buyers have a 4% loss. At the October low, the position would have been down 10.9%, well above its yield
- Should the fund drop to $9.50, the loss would be 16.2%, or double the yield they were originally seeking
What It Means: The action in the stock market this week confirms the bullish readings from the A/D lines I have been discussing over the past few weeks. In the short term, the rally may be ready to stall, but the next correction should be a good buying opportunity.
One of the factors that may push stocks even higher is a migration of money from bond funds to stocks. This would provide a lot of buying power, and the technical action of the bond market does favor higher yields.
How to Profit: I have no specific recommendations in the bond market but those who are holding shares in bond funds should develop an exit strategy now in case the redemptions/selling picks up.
NEXT: ETF Portfolio Update
|pagebreak|ETF Portfolio Update
I have recommended several different ETFs over the past month or so and wanted to take a current technical look at a pair of them and update my recommendations.
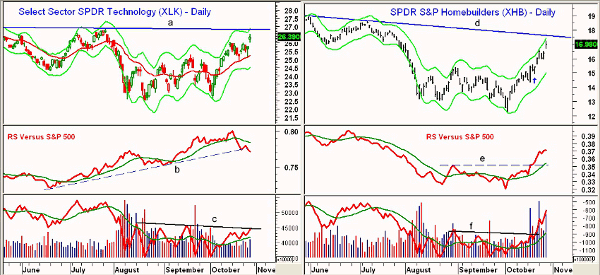
The Select Sector SPDR - Technology (XLK) has risen from the early-October lows at $22.60 to a high Thursday at $26.56.
- There is long-term trend line resistance, line a, and the daily starc+ band now at $26.84. The weekly Starc+ band is at $27.50.
- The relative performance, or RS analysis, turned positive in early September when it moved above its weighted moving average (WMA). Technology was one of the few sectors that did not make new lows in early October.
- The RS dropped below its weighted moving average last week and has now broken its uptrend, line b. This suggests the sector could be giving up its leadership
- The on-balance volume (OBV) is positive but has been lagging prices. It is close to breaking through resistance at line c
- The rising 20-day exponential moving average (EMA) has acted as good support over the past few weeks and is currently at $25.26. There is further support at $24.90
The SPDR S&P Homebuilders ETF (XHB) was recommended just last week but is already close to its major downtrend (line d) at $17.62 and is testing the daily and weekly Starc+ bands.
- There is longer-term resistance at $18.60-$19.20
- The RS line has completed its bottom formation by moving through resistance at line e. It is well above its rising WMA
- The daily OBV has also turned sharply higher after breaking through resistance at line f
- The weekly OBV and RS analysis (not shown) are also positive
- There is first support at $16-$16.40 and then at $14.90
What It Means: Given the dramatic gains of the past month, it is always a good idea to take some profits, especially on those ETFs whose relative performance analysis has deteriorated.
How to Profit: As recommended in mid-August, investors should be 50% long the Select Sector SPDR - Consumer Staples (XLP) at $29.08 and 50% long at $28.88. Sell half the position at $31.72 or better and raise the stop from $27.96 to $29.74.
Buyers should be 50% long the Select Sector SPDR - Technology (XLK) at $23.66 and 50% long at $23.12. Sell half the position at $26.64 or better and raise the stop from $21.74 to $24.48.
Buyers should also be 50% long the PowerShares QQQ Trust (QQQ) at $54.93 and 50% long at $54.06. Raise the stop to $55.34 and sell half the position at $59.44.
An additional buying zone for QQQ at $56.04 was hit on October 20. Raise the stop to $55.34.
As per last week’s recommendation, buyers should be long the SPDR S&P Homebuilders ETF (XHB) at $15.28. Sell half the position at $17.46 for a quick 14% profit and raise the stop on the remaining position to $14.68.


