New signs of weakness in gold futures and popular ETFs like GLD and GDX suggest that a new decline could unfold, ultimately setting the stage for a stronger rebound later on.
The sharp decline in gold futures and the SPDR Gold Trust (GLD) from the September 2 highs has dampened some of the high bullish sentiment, but it still seems too high. From a technical standpoint, the rally from the September 23 lows has been pretty anemic, which increases the odds of another sharp decline.
Typically, after such a sharp drop, I would expect to see a rebound that recouped 38.2% to 50% of the previous decline. After GLD dropped from a high of $185.84 to a low of $154.16, just a 38.2% retracement would have taken the fund back to $166.31, while the 50% retracement resistance level stands at $169.90. GLD, however, has only been able to rally as high as $164.19.
This is a sign of weakness, and from a time standpoint, I would not be surprised to see the correction in gold last another month, possibly even two.
This correction may be similar to what occurred in 2009 and early 2010, when gold peaked at the start of December 2009 and the correction lasted through March 2010. As I have pointed out before, it was deep enough and lasted long enough to turn many bearish on gold. Let’s look at the current technical outlook.
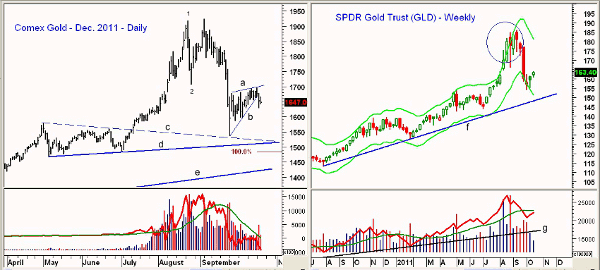
Chart Analysis: The daily chart of the December 2011 Comex gold contract shows that it has just completed a bear flag formation (lines a and b). There is initial support now at $1628 and a daily close below $1596 will signal acceleration on the downside.
- There is converging chart support, lines c and d, in the $1500-$1520 area
- The bear flag has targets at $1492 with the equality target (using the initial drop from point 1 to point 2) at $1484
- The longer-term uptrend, line e, which goes back to 2010, is now in the $1430 area
- The daily on-balance volume (OBV) deteriorated in early September before prices plunged. The OBV is leading prices lower, as it has already dropped to new correction lows
- The weekly OBV (not shown) formed a negative divergence at the highs
- For December gold, there is first resistance at $1656-$1665 with much stronger resistance in the $1700 area
The weekly chart of the SPDR Gold Trust (GLD) is updated through October 14 and shows that GLD has rebounded for the past two weeks after closing below the weekly Starc- bands.
- GLD had traded above the weekly Starc+ bands for five weeks in August, and this was one of the red flags that warned of gold’s drop
- The weekly Starc- band is now at $151.20 with the weekly uptrend, line f, in the $148-$149 area
- The weekly OBV formed a negative divergence at the recent highs before dropping below its weighted moving average (WMA).Volume has turned up recently, but it still below its WMA
NEXT: Latest on Gold Miners ETF GLD; How to Profit
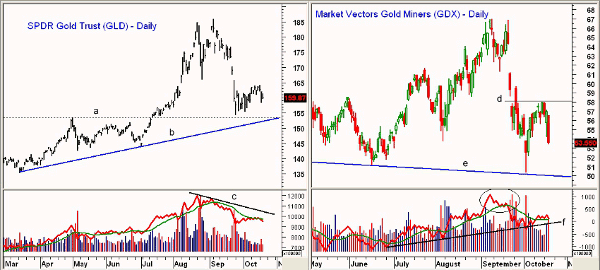
|pagebreak|The daily chart of the SPDR Gold Trust (GLD) shows that last week’s narrow range was followed by selling early this week. The daily chart shows next support in the $152.50-$155 area.
- A break of the uptrend, line b, would not be surprising on a further decline, but it would not change the major trend
- The daily OBV formed a negative divergence at the highs, line c, and then gave a short-term sell signal before prices plunged
- The OBV is back below its weighted moving average and volume on the recent rebound was weak
- It would take a move above line c to turn the OBV positive
- There is first resistance now at $162.50-$164 with the 38.2% Fibonacci retracement resistance level at $166.31
The Market Vectors Gold Miners ETF (GDX) peaked at $66.98 on September 9 and hit a low of $50.42 less than one month later. This was a drop of 24.7%. GDX was hit with heavy selling on Wednesday and looks ready to test these lows.
- The daily chart does show that GDX has a trend line support in the $50 area, line e
- There is additional support from 2010 in the $46-$47.50 area
- Volume picked up on Wednesday, but the daily OBV is still barely above its weighted moving average
- The weekly volume (not shown) is below its WMA but did confirm the most recent highs
- There is initial resistance now at $56.60 and a daily close above the $58 level (line d) is needed to stabilize the chart
What It Means: The lackluster rally in gold and weakness in the gold miners (some were down 3%-5% on Wednesday) suggests that the rebound is over. Further concerns about the Eurozone debt problems have not supported gold prices, and the stronger US dollar is also hurting the metals.
A decline in Comex gold to the $1500 level and GLD to the $149-$151 level could complete the majority of gold’s correction and set the stage for a stronger rebound.
How to Profit: The monthly OBV analysis indicates that the major trend in gold is still positive…as it has been for many years. For those who hedged their long positions in GLD, as recommended in August, look to take off the hedges if GLD reaches $150.50.
The gold miners look quite vulnerable, and if you are long any of the individual mining stocks, be sure your protective stops are in place.


