The charts suggest that oil is forming a major bottom, and if confirmed, solid, risk-controlled entry points in a leading ETF and select oil stocks may soon be presented.
The reversal in the stock market last week was impressive, and with Monday’s sharp gains, some of the Advance/Decline (A/D) lines have overcome first key resistance. This makes it more likely that the stock market completed a significant bottom last week. The extent of the selling on the first pullback will tell us more.
Crude oil has also rebounded sharply, as the December contract closed last week $8 above the lows. As discussed previously, crude oil often leads the S&P 500 and its tracking ETF, the Spyder Trust (SPY). The weekly volume pattern in crude oil is consistent with the formation of an intermediate-term low, which if confirmed should be a positive for stocks as well.
Therefore, a pullback in the United States Oil Fund (USO), a leading crude oil ETF, as well as in two select energy stocks, should provide a good entry point on the long side where the risk can be well controlled.
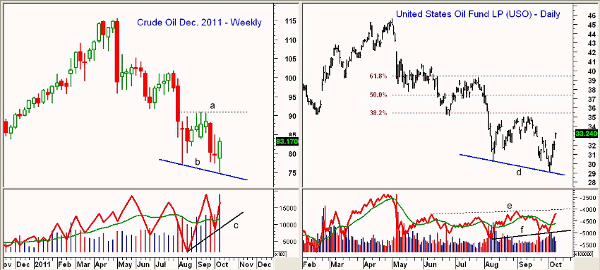
Chart Analysis: The weekly chart of the December crude oil futures contract shows that it formed lower lows, line b, last week. There is initial resistance now in the $85 area with major resistance in the $90-$91 area, line a.
- Volume was strong last week and the on-balance volume (OBV) has risen sharply above its weighted moving average (WMA)
- The bullish divergence in the OBV, line c, is positive, as it suggests there were fewer sellers at last week’s lows than there were in August
- There is initial support for crude oil in the $83.50 area with stronger support now at $82
The United States Oil Fund (USO) is the most liquid of all oil ETFs. The fund peaked in early May at $45.60, and with Monday’s higher close, it is still 27% below its 2011 highs. USO is already back to first chart resistance in the $34-$35 area.
- The 38.2% Fibonacci retracement resistance is at $35.45 with the 50% resistance level at $37.30
- The daily OBV has also formed a positive divergence, line f, as while USO formed lower lows, the OBV formed higher lows
- To confirm the bullish divergence, the OBV needs to move through resistance at line e
- As shown on Friday, the weekly chart also shows both a short- and longer-term bullish divergence that suggests an important low is forming
- There is first support in the $32 area with stronger support at $30.50-$31
NEXT: 2 Oil Stocks to Monitor Closely
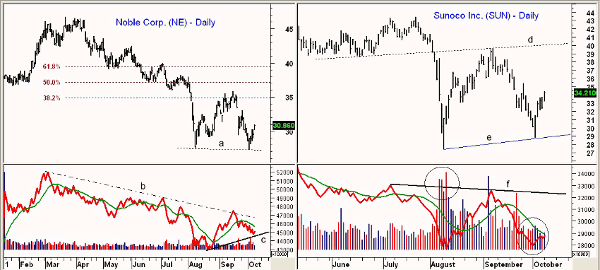
|pagebreak| Noble Corp. (NE) is a $7.8 billion offshore oil drilling contractor that hit a low last week of $27.33, which was just below the August low of $27.68. The daily chart shows a potential double-bottom formation, line a.
- There is next resistance for NE at $31.50-$32.50 with much stronger resistance in the $35 area. This corresponds to the 38.2% retracement resistance from the March highs at $46.72
- In the $37 area, there is more important chart resistance, as well as the 50% resistance level
- The OBV has held well above the August lows, line c, which is a positive sign. A strong move above the downtrend, line b, and the previous peak, will confirm that a low is in place
- There is support on the daily chart in the $29-$29.60 area
Sunoco Inc. (SUN) is a $4 billion oil and gas refining company that currently yields 1.8%. It made a low last week of $28.79, which was well above the August low of $27.36.
- The volume at last week’s lows was much less than what occurred in August (see circles)
- The daily OBV is still just barely below its weighted moving average, but it did hold above the August lows. The daily OBV needs to move through resistance at line f to complete its bottom formation
- The weekly OBV (not shown) has been acting stronger than prices
- SUN is already quite close to next strong resistance in the $35 area with further resistance at $36.80-$38.20
- Short-term support stands at $32.20-$32.60 and then at $31
What It Means: The positive weekly divergence in the OBV for crude oil does suggest that a major bottom is being formed. To confirm the divergence, the OBV needs to move above its previous high, which is measured using the same rules I discussed in the most recent Trading Lesson (see “Accurately Analyzing RSI Divergences”).
Once USO, NE, and SUN have lower daily closes, we should see a 38.2%-50% pullback that will set up a good buying opportunity.
How to Profit: For the United States Oil Fund (USO), go long at $31.68 with a stop at $28.77 (risk of approx. 9.1%).
For Noble Corp (NE), go long at $29.56 with a stop at $27.08 (risk of approx. 8.4%).
For Sunoco Inc. (SUN), go long at $31.74 with a stop at $28.59 (risk of approx. 9.9%).


