Chart patterns indicate that an upcoming pullback in the tech sector will be well supported, providing a good opportunity to go long select sector ETFs and stocks.
While the S&P 500 and Spyder Trust (SPY) have failed to surpass the 50% retracement resistance from the May highs, the Nasdaq 100 is a different story. Technology stocks have been getting lots of press lately, and many hope that this sector will help turn the market around.
Though the Nasdaq 100 is made up of both technology and biotech stocks, it is the technology space that has been getting the most attention. A closer look at the market internals for the Nasdaq 100, as well as the key chart points and the sub-industry tech groups suggests that we should get a pullback in the next week or so that will provide a better risk/reward entry level for those who are not already long.
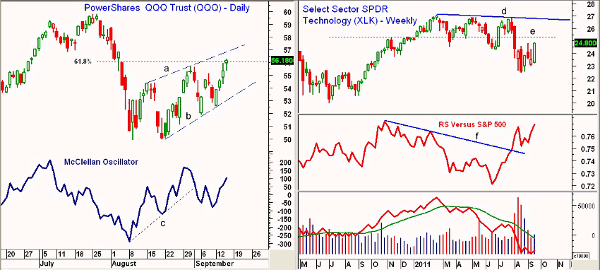
Chart Analysis: The daily chart of the PowerShares QQQ Trust (QQQ), which tracks the Nasdaq 100 index, shows that it closed above the 61.8% Fibonacci retracement resistance on Thursday. This suggests that decline from the July highs is over.
- There is next resistance at $56.80-$57 (line a) with the 78.6% retracement resistance at $57.71
- The McClellan Oscillator broke its uptrend, line c, on September 1. This is often a negative short-term signal, but the oscillator has been able to hold above the most recent lows
- There is initial support at $55.20 with stronger support at $54-$54.50
- The daily uptrend, line b, is now at $53.30
The weekly chart of the Select Sector SPDR - Technology (XLK) shows that there is next strong resistance in the $25.30 area, line e. There is major resistance in the $26.80 area, line d.
- The weekly relative performance, or RS analysis, broke its major downtrend, line f, in late July
- As I noted in mid-August, the daily RS analysis was positive and was forecasting the recent strength
- There was heavy weekly volume on the early-August decline and the weekly on-balance volume (OBV) is still below its weighted moving average (WMA)
- The daily OBV (not shown) is above its weighted moving average and has just moved above trend line resistance
- There is initial support now in the $23.80-$24.20 area with more important support in the $23-$23.20 area
NEXT: 4 Tech Plays to Buy on the Next Pullback
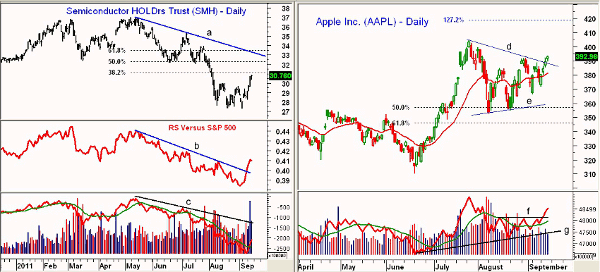
|pagebreak|The Semiconductor HOLDRs Trust (SMH) has rallied 12.7% in the past seven days from the low at $27.28. It is already close to the 38.2% retracement resistance at $31.16.
- The more important 50% Fibonacci resistance is at $32.30, which also corresponds to strong chart resistance
- The daily downtrend, line a, and the 61.8% resistance are in the $33.20-$33.50 area
- The daily RS has broken its downtrend, line b, consistent with the recent strength. Typically, if this is a major bottom, we should see a pullback in the RS over the next week
- Volume has been strong over the past week but the OBV is still well below its downtrend, line c
- There is first good support in the $29.30-$29.60 area with stronger resistance in the $28.40 to $28.60 area
One of the tech sector leaders, Apple, Inc (AAPL), completed its bull flag formation (lines d and e) on Wednesday. As I noted in a recent article on flag formations, the potential upside targets were either at $404.50, which was the recent high, or the 127.2% retracement resistance target of $418.90.
- The OBV has confirmed the upside breakout, as it moved through resistance, line f, one day ahead of prices. The OBV has longer-term support at line g
- The weekly OBV (not shown) is positive and above its weighted moving average
- There is first support for AAPL at $380-$382 and the 20-day exponential moving average (EMA). There is stronger support in the $366-$372 area
- A close below $355 would call the flag formation into question
What It Means: The positive action in the Nasdaq 100 has turned the focus on the technology and biotechnology areas. A rally back to the +160 level in the McClellan Oscillator (now at +103) could mark a short-term top.
The technical action suggests that the next pullback will be well supported. This should provide a good entry point for those who are looking to establish new long positions in the technology sector. Buying in at current levels seems to carry excessive risk and patience would be warranted.
How to Profit: As previously recommended in the August article, buyers should be 50% long the Select Sector SPDR - Technology (XLK) at $23.57 and 50% long at $23.12, as the low was $22.47. Raise the original stop from $21.74 to $22.84, sell half the position at $25.94 or better, and raise the stop on the remaining position to $23.57.
Those who are not already long XLK could buy at $24.12 with a stop at $22.84 (risk of approx. 5.2%).
For the PowerShares QQQ Trust (QQQ), go 50% long at $54.62 and 50% long at $53.62 with a stop at $49.80 (risk of 7.9%).
For the Semiconductor HOLDRs Trust (SMH), go 50% long at $29.46 and 50% long at $28.78 with a stop at $26.93 (risk of approx. 7.5%).
For Apple Inc. (AAPL), go long at $385.80 with a stop at $357.20 (risk of approx. 7.3%). On a move above $396, raise the stop to $369.30.


