Even after sharp recent declines, the chart patterns show that four of the most prominent global bank stocks still have more downside potential.
As if the US debt-ceiling debacle and credit downgrade wasn't enough, now the market has shifted its attention to rumors swirling in Europe about the solvency of several large banks and even an entire country.
France has come under the gun, as it has invested heavily to help prop up Italy and Spain, putting its own credit rating at risk in the process. Though the French banks received most of the attention, it is important to look at some of the other major global banks.
By applying basic chart projection techniques, we can get a better idea of whether this is the beginning or the end of the slide.
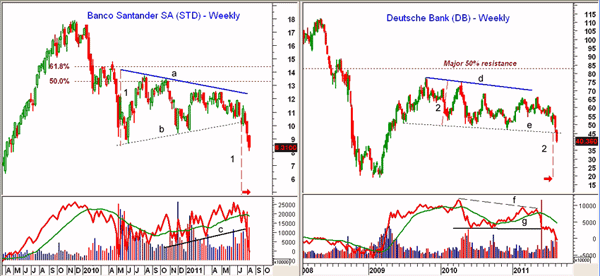
Chart Analysis: Banco Santander (STD) is a $56 billion bank that operates primarily in Spain, the United Kingdom, and other European countries. The stock was down over 9% Wednesday. The weekly chart shows that over the past few weeks, it has completed a flag formation (lines a and b) that was last highlighted in March. (See "Two Stressed Out Euro Banks.")
- After collapsing from the 2009 high at $17.89, STD slightly exceeded the 50% retracement resistance but stayed below the more important 61.8% resistance level
- By measuring the width of the flag formation (line 1), you can subtract this distance from support at line b to get a downside target. This projects a drop to the $5 area (see arrow)
- Volume has been heavy, dropping the weekly on-balance volume (OBV) below its support at line c
- There is first strong resistance now in the $9.40-$10 area
Deutsche Bank (DB) looks ready to close below important weekly support (line e) this week. The rally from the 2009 lows hit a high of $77.49 in October 2009, but failed to reach the 50% resistance of the decline from the 2007 highs at $145.77. The stock dropped 11.5% Wednesday to close at $40.36.
- There is next good support for DB in the $38-$35.50 area
- The width of the weekly trading range (lines d and e) is $26, and this range can be used to give downside targets. This width (line 2) can be subtracted from the breakdown level at $45 (line e) to give a downside target in the $19 area
- The weekly OBV dropped below its weighted moving average (WMA) in May and then violated more important support at line g. The daily OBV (not shown) is also negative
- There is initial resistance in the $45-$46 area, which corresponds to last week's lows
NEXT: The Two Worst British Bank Stocks |pagebreak|
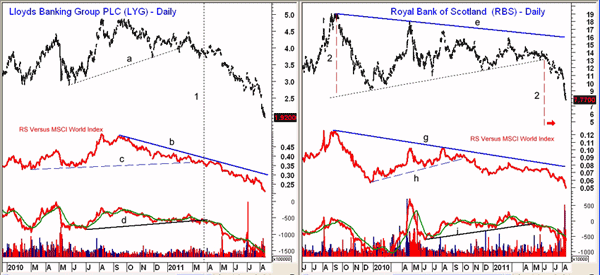
Lloyds Banking Group PLC (LYG) is a United Kingdom-based, $40 billion financial company that provides a wide range of services. It was down 7.7% Wednesday but it has been in a solid downtrend after breaking support, line a, in February. It is down over 53% for the year.
- The relative performance or RS analysis versus the MSCI World Index peaked in the fall of 2010 and has since been in a solid downtrend, line b. The violation of support (line c) was confirmed in late March (line 1) which projected further price weakness
- The daily OBV broke support at the same time as the RS, and has continued to make lower lows. The weekly OBV (not shown) has been in a downtrend since early March
- The targets from the flag formation at $2.30 have been exceeded and LYG has broken below the 2009 lows.
Royal Bank of Scotland (RBS) also completed a flag formation, lines e and f, in the middle of June and has since dropped over 40%. As discussed earlier, the width of the triangle formation, line 2, can be used to determine potential downside targets.
- Often times I measure the width at several places to get different targets because the targets from the widest part of the triangle are sometimes not met. By taking this width (line 2) and measuring down from the break of support at line e, you get a target below $5.00
- The relative strength (RS) line broke support, line h, well ahead of prices and gave advance warning of the price decline
- The daily OBV held above its support (line i) until May and the volume has been heavy this week. The weekly OBV (not shown) has been negative since May
- There is some support from 2009 in the $4.50-$5.00 area with the 2009 lows at $2.86
What It Means: All four of these bank stocks have been looking weak for most of the year, and I discussed both UK banks, Lloyds Banking Group Plc (LYG) and Royal Bank of Scotland (RBS), as far back as February. (See "The Two Worst British Banks.")
Unfortunately, while all are oversold on a short-term basis, the longer-term patterns suggest that they will decline further by the end of the year. If the overall market stabilizes, all could see a decent rebound, but don't get sucked in by any "value" arguments, as such a rally should be followed by a further decline.
How to Profit: Protect your capital by staying out of the big money-center banks, whether in the US or overseas.


