New fears about the economy have trumped the debt resolution and the selloff is now on. Here are the critical support levels and potential downside targets to watch for the major stock index ETFs.
The anemic market response to the raising of the debt ceiling early Monday was followed by heavy selling on Tuesday, and some of the major averages have already broken below the March lows.
There is little optimism for stocks or the economy this week, and by the time we get the monthly jobs report on Friday, things are unlikely to get better. Bearish sentiment will clearly pick up this week, although it currently does not seem to be overly high. This allows for stocks to decline even further.
The McClellan Oscillator tried to bounce, but had dropped to oversold levels at –276 on Tuesday. Stocks are higher early Wednesday, so maybe we will now get an oversold bounce. If we do, it is likely to be followed by another wave of selling.
The Advance/Decline (A/D) lines on the S&P 500 and Dow Industrials have broken support after confirming the price highs early in the year. This is similar to what occurred in the spring of 2010, which resulted in the decline to last summer’s lows.
Therefore, another month or two of sideways to lower trading is possible, and it would take several consecutive days of strong market internals to improve the technical outlook. These are the key stock index ETFs and important price levels to watch for each one.
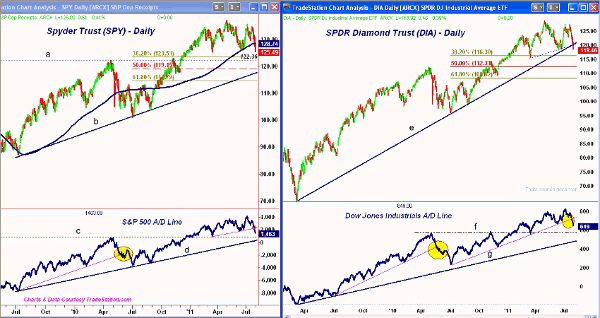
Chart Analysis: The Spyder Trust (SPY), which tracks the S&P 500, has closed decisively below the rising 200-day moving average (MA) at $128.74 and is just above the March lows at $125.28. This low is likely to be broken early Wednesday, as overseas markets are sharply lower.
- The 38.2% retracement support from the July 2010 lows is at $123.51 with the 2010 highs (now support) at $122.36, line a
- The more important 50% retracement support is at $119.15 with trend line support at $118, line b
- The S&P 500 A/D line has broken below initial support with more important support from 2010 at line c. The uptrend from 2009, line d, is a bit lower
- A similar trend line break in May 2010 (highlighted in yellow) was followed by a couple months of market weakness
- There is initial resistance for SPY at $128.74 (200-day MA) with much stronger resistance in the $130-$131 area
On Tuesday, the SPDR Diamonds Trust (DIA), which tracks the Dow Industrials, violated its long-term uptrend, line e, and what could be the neckline of the head-and-shoulders (H&S) top formation discussed last week.
- The 38.2% retracement support from the 2010 lows is at $116.30 with the March 2011 lows at $115.51. The 50% retracement support is at $112.31
- The downside target from the H&S top is in the $107.50 area, or 10,850 on the Dow Industrials
- The uptrend in the Dow Industrials’ A/D line from last summer’s lows has been broken, but the A/D line did confirm the early-May highs. A similar trend line break was observed in 2010 (highlighted in yellow)
- The next support for the A/D line is at the 2010 highs (line f) and then at the uptrend, line g
- There is initial resistance in the $121-$122 area with much stronger resistance now in the $123.70-$125 area
NEXT: Key Downside Targets for All Four Major Stock Index ETFs
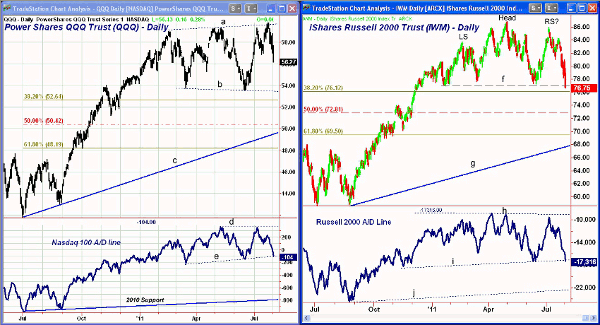
|pagebreak|The daily chart of the PowerShares QQQ Trust (QQQ), which tracks the Nasdaq 100 Index, shows what may be a broadening top formation (lines a and b), as it has just broken the June lows at $56.87. There is more important support in the $53.50 area, line b.
- The 38.2% support from the 2010 lows is at $52.64 with the 50% retracement support at $50.42. The longer-term uptrend, line c, is now in the $49.50 area
- The Nasdaq 100 made new highs in May, but failed to make higher highs in July, line d
- The A/D line is now testing stronger support at line e and is leading prices lower. This suggests that the 2011 lows in QQQ will also be broken. Support in the A/D line from 2010 is much lower
- There is strong resistance for QQQ at $57.50-$58.50 with major resistance now above $59
The iShares Russell 2000 Index Fund (IWM) continues to act the weakest, closing below strong support, line f, in the $77.23 area. This could complete a complex H&S top formation with the 38.2% retracement level just below Tuesday’s lows at $76.12.
- The 2010 highs are at $74.66 with the 50% retracement support from the August 2010 lows at $72.81. The downside target from the H&S top formation is at $67.50, which corresponds to the uptrend, line g
- The Russell 2000 A/D line closed just below support dating back to last fall, line i. The next support from 2010 (line j) is still much lower
- IWM has first resistance at $78.66-$80 with much stronger resistance in the $82.30-$84 area
What It Means: The nature of the selling throughout the past week or so has clearly weakened the technical outlook for the stock market. The confirmation of the recent highs by both the weekly and daily NYSE A/D lines continues to indicate that the bull market is not yet over. Historically, in most bull markets, the A/D line has diverged from prices well before the market averages made their final highs.
That being said, August is likely to be a rough month, and the selling could continue into early fall. We could see a sharp downdraft to the next level of support for the S&P 500, which lies in the 1195-1227 area. If this occurs before we see at least a one- to two-day rebound, then it could mark a panic low and the start of a trading range similar to what we saw last summer.
My downside target zones for these four stock index ETFs are as follows:
- S&P 500: Spyder Trust (SPY) - $119.15-$122.36
- Dow Industrials: SPDR Diamonds Trust (DIA) - $112.31-$115.51
- Nasdaq 100: PowerShares QQQ Trust (QQQ) - $50.42-$53.50
- Russell 2000: iShares Russell 2000 Index Fund (IWM) - $71.50-$74.66
How to Profit: For those whose cash position is relatively low (say 10%-15%), use any rally to raise some more cash or hedge stock positions by selling in-the-money options against existing long stock positions.
Despite the market decline, many who bought ETF puts last week have been disappointed. Those who bought the inverse ETFs have done better, and that would be the more favorable hedging method for those who are not experienced with options.
Despite the overall market weakness, there are likely to be some good buying opportunities as we approach this fall, which is a seasonally strong period for several market sectors.


