Despite cheap valuations, weak chart patterns and the relative weakness of the overall financial sector indicate that big banks like Bank of America, Citigroup, and JPMorgan Chase are sucker’s bets.
The dramatic stock market rally over the past few weeks has caused some analysts and advisors to recommend some of the beaten-down big banks because their valuations are supposedly attractive.
There is always the temptation to step in and buy the bargains once a well-known company declines sharply. These choices are often made on the basis of projected earnings, book value, or some other fundamental justification.
One of the more painful lessons all investors learn is that a 20%-40% loser in your portfolio can offset the nice gains from the other holdings. Of course, this is why risk management is so important.
If you can avoid taking a big hit in one stock or one trade, your portfolio has a much better chance to show positive performance. The big banks have been on my “stinker list” for most of the year. In February, my technical appraisal of both Bank of America (BAC) and Citigroup (C), was negative, and I advised having stops in place to avoid having “big losers in your portfolio.”
Two technical tools that I find most important when gauging a stock’s potential are the on-balance volume (OBV) and relative performance, or RS analysis. Stocks that have positive volume patterns and are acting better than a market average like the S&P 500 are the best stocks to consider buying.
So using volume and RS analysis, do the Select Spyder SPDR - Financial (XLF), Bank of America (BAC), Citigroup (C), and/or JPMorgan Chase (JPM) deserve consideration for your portfolio?
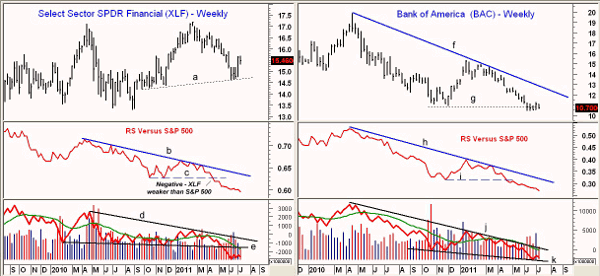
Chart Analysis: The Select Spyder SPDR - Financial (XLF) bounced initially from the weekly trend line support in the $14.60 area, but it closed lower last week.
- A break of weekly support will suggest a drop to the $14-$14.20 area, if not the August 2010 lows at $13.29
- The RS analysis has been in a downtrend since early 2010, line b. The violation of support at line c was a strong sign that XLF would continue to be weaker than the S&P 500
- The weekly on-balance volume (OBV) is in a well-defined downtrend (line d) and violated support in May, line e
- Initial resistance is at $15.90-$16 and then at $16.50 after that
Bank of America (BAC) has not participated in the market’s recent strength, as it is just barely above its recent lows at $10.41.
- Last year’s lows at $10.90 (line g) were violated in June
- The RS shows a long-term pattern of lower highs and lower lows, as the downtrend, line h, is well established. The break of RS support at line i preceded the recent decline
- The weekly OBV made further new lows in June, and the pattern of lower lows, line k, is negative. Resistance stands at the downtrend (line j) and the declining weighted moving average (WMA)
- There is strong resistance in the $11.50-$12 area
NEXT: Latest Charts for Citigroup, JPMorgan Chase|pagebreak|
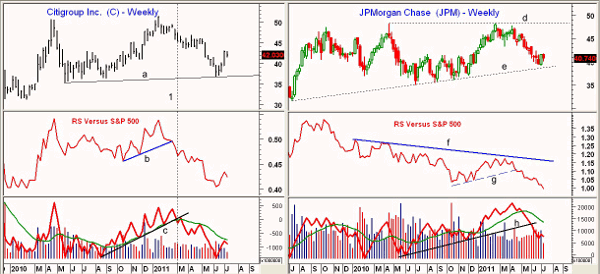
Citigroup (C) has rebounded sharply from its recent lows at $36.76 and has recently tested the $43 area. This is a gain of 17% from the lows, but it has not caused significant improvement in the technical outlook. The reverse stock split by Citigroup in March prompted me to warn against buying shares (see “Big Banks Flunk Smell Test”).
- There is initial support for Citigroup in the $40 area with more important support at $37.80-$38
- A break below $36.76 (line a) would be very negative and suggest a drop to the $31-$32 area
- The RS violated support (line b) in mid-February, and this was followed by a break of OBV support, line 1, in early March
- The RS has bounced from the lows but still shows a pattern of lower highs and lower lows. It would take some time for the RS to bottom out
- The weekly OBV has just rebounded to its declining weighted moving average and shows no strong signs yet of bottoming
JPMorgan Chase (JPM) is trying to hold above long-term support, line e, in the $38.70 area. JPM had only a weak, 6% bounce from the lows and has further resistance in the $42-$42.40 area. The company is scheduled to report earnings on Thursday (July 14).
- The RS violated support, line g, in April when the stock closed at $44.68. It is dropping sharply, thus forecasting further weakness for JPM
- The weekly OBV dropped below long-term support, line h, in June, and is well below its declining weighted moving average
- There is short-term support now at $39.70-$40.20, which, if broken, will signal a drop to $38.70
- If this level is broken, the next band of weekly support is in the $35.55-$37.20 area
What It Means: The lack of participation by the financial sector is certainly limiting the upside for the major averages like the S&P 500. In addition, the very weak technical action in the financial sector reinforces the negative technical outlook for these three big banks. They should be avoided for now, despite what may seem like compelling valuations, as they can always get cheaper.
How to Profit: If you are in any of these three stocks or any of the major money-center banks, you should have stops placed under the recent lows. If these lows are violated, then another wave of selling could push them even lower.


