Market leaders Netflix (NFLX) and Amazon.com (AMZN) have rallied sharply recently, and while a pullback is likely, the charts for both stocks show no signs of major tops.
On June 13, I took a look at the Nasdaq 100 index, which includes some of the most widely followed stocks, concluding that “Tech Giants Can Still Go Lower.”
This analysis was based in part on the relationship of four key stocks to their weekly Starc- bands: NetFlix Inc. (NFLX), Google (GOOG), Amazon.com (AMZN), and Apple (AAPL).
While the deterioration in the weekly analysis for GOOG and AAPL did not favor buying even if they did get more oversold, I did recommend buying the other two market leaders.
The recommended buy levels were reached several weeks ago for NFLX and AMZN, and my initial sell zones have also been hit. So what’s next?
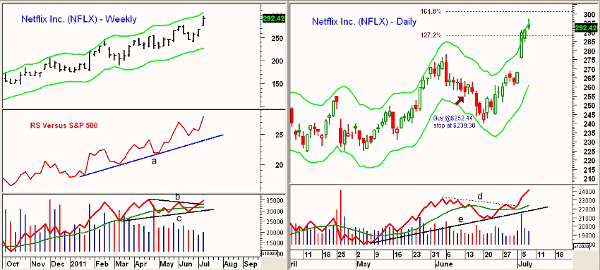
Chart Analysis: The weekly chart of NetFlix Inc. (NFLX) shows the strong rally over the past three weeks, as the stock is now getting closer to the weekly Starc+ band at $305.
- The weekly relative performance, or RS analysis, continues to look strong, as it surged to new highs. This indicates that NFLX is still acting much stronger than the S&P 500
- The RS is well above its long-term uptrend, line a
- The weekly on-balance volume (OBV) has broken through its resistance at line b. The OBV is well above its weighted moving average (WMA) and the support at line c
- Initial weekly support is at $276-$277.70, which corresponds to the June highs and this week’s open
The daily chart shows that NFLX closed well off the highs on Thursday after surging well above the daily Starc+ band. The 127.2% target at $288 has been exceeded with the 161.8% target at $301.
- The daily OBV broke out to the upside on Monday when resistance at line d was overcome. The following day, NFLX gapped sharply higher
- The OBV now shows a strong uptrend, line e
- NFLX now has initial support in the $276-$280 area with further support at $270. The daily Starc- band is now at $260
- NFLX came very close to that daily Starc- band on June 20 with its low at $240.12
NEXT: See Latest Chart Action for Amazon.com (AMZN)
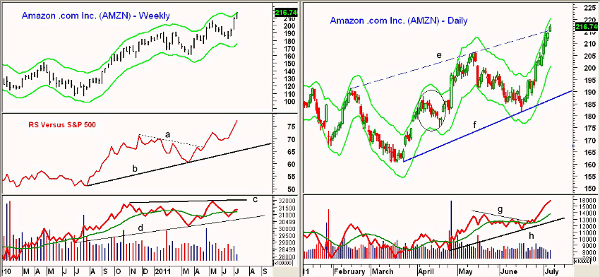
|pagebreak|Amazon.com (AMZN) closed Thursday within 0.3% of its weekly Starc+ band. Though AMZN can still move higher, this indicates that risk is currently high on new long positions.
- A rally from the June lows that is equal to the rally from March low to the May high could take AMZN to the $228 area
- The weekly RS analysis broke through resistance (line a) in April and has made convincing new highs
- The RS shows a long-term uptrend (line b) that goes back to the summer of 2010
- The weekly OBV did confirm the May highs, line c, but has not yet confirmed the recent highs
- There is initial weekly support at $206.70-$208
The daily chart shows that AMZN has been testing its daily Starc+ band over the past seven days, and the trend line resistance, line c, has also been exceeded.
- Measured from Thursday’s high at $217.80, the 38.2% support is at $209.50 with the 50% support at $204.50
- The daily OBV overcame resistance at line g in late June and has moved well above its previous highs. The OBV is well above its rising weighted moving average and its uptrend, line h
- The daily Starc- band is at $200.50 with the daily uptrend at $187
- A deeper correction—like the one that occurred in April (see circle)—is also possible
What It Means: The major averages have overcome all of their retracement targets, as the surge since the June 23 lows has been one of the strongest in many years.
NFLX and AMZN are still clearly market leaders, unlike Apple, Inc. (AAPL), which appears to have lost its leadership for now. Nevertheless, both stocks are likely to consolidate or correct over the next week.
Those currently long could consider hedging their long positions with options, as the premiums are high. Take off the hedges or use trailing stops if AMZN or NFLX decline 1.5%-2% from the recent highs.
I would continue to hold long positions, as I see no signs yet of a major top.
How to Profit: As per the June 13 report, the recommended buying level for NetFlix Inc. (NFLX) at $252.44 was hit on June 16. The stop at $239.30 did hold on June 20, and traders should have sold half the position at $276 on July 5 for a 9.2% gain. Raise the stop on the remaining position from $249.40 to $251.44.
For Amazon.com (AMZN), buyers should be long from June 16 at $183.04, as the low that day was $181.59. Half that position was sold at $199.60 for a 9% profit, and the stop on the remaining position was raised from $174.66 to $182.60. I would now recommend an even tighter stop at $191.20.


