Shares of Apple, Inc. (AAPL) have historically outperformed the overall market, but technical indicators suggest that relationship may be changing, leaving the stock vulnerable to future selling.
Technology bellwether Apple, Inc. (AAPL) has closed higher for the past five days in a row, and with Wednesday’s close at $351.76, the stock is up 13.2% from the June lows. Though this performance is pretty impressive, is it good enough to keep AAPL as a market-leading stock?
Identifying and monitoring the market leaders can help you to spot short-term turning points. For example, if several market-leading stocks are close to the weekly Starc+ bands (a high-risk buying zone) it will suggest that the overall market is also due for a rest.
See related: Trading with Starc Bands
Though AAPL has had nice gains from recent lows, how does it compare with other market bellwethers?
Amazon.com (AMZN) and NetFlix Inc. (NFLX) are up 17.9% and 21.2%, respectively, since the June lows and both have already moved well above their May highs.
The S&P 500 is still 2.3% below its recent highs, while AAPL is 3.5% below its 2011 highs. By looking at AAPL closely, we can further determine why its action is so important to the overall markets.
One can identify market leaders and laggards by either comparing the chart of the stock in question to that of a key market average, or through relative performance, or RS analysis.
See also: Spot Leaders and Losers with RS Analysis
Let’s now take a look at the broad market and AAPL.
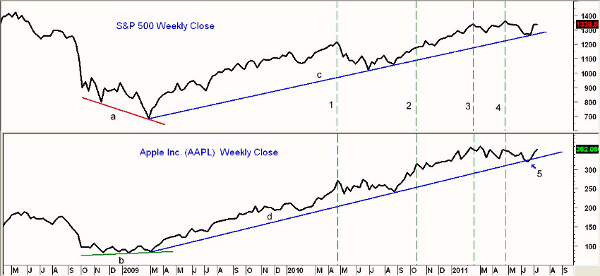
Chart Analysis: These weekly charts of the S&P 500 and Apple, Inc. (AAPL) go back to May 2008. In March 2009, as the S&P 500 was making sharply lower lows (line a), AAPL was making higher lows, line b. Its low of $82.05 was well above the January 2009 low of $80.05.
- By early-April 2009, AAPL had moved above the November 2008 high of $112.19, but the S&P 500 did not surpass its corresponding high until July. This was a sign of leadership
- AAPL often would make new highs ahead of the S&P 500, but it is most important to note that when the S&P 500 makes a significant new highs—like it did in April 2010 (line 1)— AAPL is also making a new high
- In October 2010, AAPL made a new high (line 2), while the S&P 500 did not make a new high until November
- There was a similar situation in February 2011, as AAPL made a new high (line 3) a week ahead of the S&P 500
- However, in April, AAPL made a high of $355.13, which was below the February peak of $364.90. In contrast, the S&P 500 made a higher high later that month (line 4)
- During the market’s decline in June, the S&P 500 held its uptrend, line c, but AAPL slightly violated its similar uptrend (line d) as noted at point 5
- The lower highs and the trend line break are early signs that AAPL may no longer be a market leader
NEXT: Know the Important Price Levels to Watch
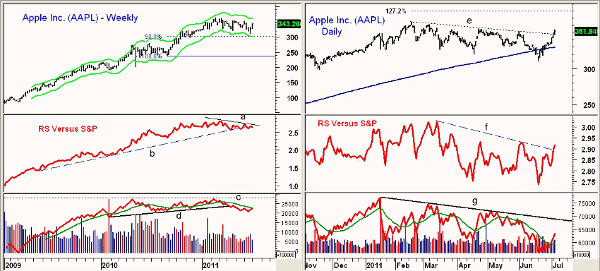
|pagebreak|The weekly chart of Apple, Inc. (AAPL) shows that its June low of $310.50 was well above both the 50% support level, as calculated from the 2010 lows, and the weekly Starc- band at $301.
- The weekly Starc+ band is now at $363.35
- The relative performance, or RS analysis, has formed lower highs over the past four months (line a) and has been testing its uptrend, line b, since May. A drop in the RS below the April lows would be more negative
- The weekly on-balance volume (OBV) failed to make new highs in 2011, line c
- The OBV then violated support at line d in mid-April, confirming this negative divergence. As of last week, it was still below its declining weighted moving average (WMA) but should move back above it this week
The daily chart of AAPL shows that the daily downtrend, line e, was overcome this week. There is next resistance at $355 with more important resistance in the $361-$364.90 area.
- The 127.2% retracement resistance target is at $380
- The daily RS analysis has been declining since March, and its downtrend, line f, has just been overcome. It needs to move above the March highs to reverse the cycle of deterioration
- The daily OBV also looks weak, as it has formed lower highs, line g, in 2011. It is now back above its WMA, but is below the resistance from May
- There is first support now at $333-$338. There is further support at $329 and the 200-day moving average (MA). AAPL closed below the 200-day MA for several days in June
What It Means: As the current stock market rally develops, it will be important to watch AAPL’s price in relation to the S&P 500. If the S&P 500 is able to make new highs for the year and AAPL is not, it would add further evidence to the viewpoint that AAPL has lost its leadership role.
How to Profit: If AAPL is no longer a market leader, once the current rally tops out, the stock is likely to be hit with heavier selling when the market starts to decline. Therefore, AAPL shareholders need to keep a close watch on its share price and take action to protect their profits.


