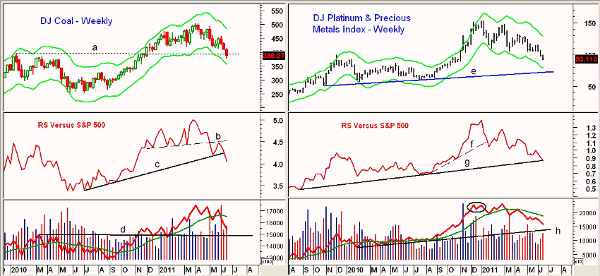
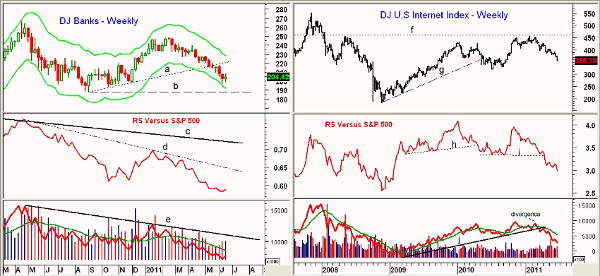
These four industry groups have badly lagged the broad market this year, and the relative performance, or RS analysis, predicts more underperformance may lie ahead.
It has been a dismal month for stocks, and even with last Friday’s bounce, the S&P 500 is still down 5.5% for June. Last week, I looked at several of the industry groups, including utilities and restaurants, that were outperforming the S&P 500, but of course, there are also those industry groups that have done worse.
Clearly, we would like to stay invested in the strongest sectors and stocks, but equally important is doing your best to avoid the weakest areas of the stock market. This can be done in a superficial manner by comparing your stock or ETF’s performance to that of a major average like the S&P 500, or an ETF like the Spyder Trust (SPY), which tracks it.
Don’t get too concerned about day-to-day divergences, but when your stock or ETF is weaker for a week or two, it should be more of a concern.
Over the past three months, there are four industry groups that are down 11.7%-17.6% compared to the 5.8% decline in SPY, and the poor performance for several of these groups might come as a surprise.
By looking at these underperforming industry groups, we can determine whether any are ready to turn around and hopefully gain some insight on how to avoid the weakest areas of the market in the future.
Chart Analysis: The fear over nuclear power after the tragedy in Japan was thought by some to be positive for the coal industry, but the Dow Jones Coal index is down 17.6% over the past three months. The weekly chart shows that the index has now dropped below the highs made in early 2010, line a.
- The major 50% support level has been reached, with the 61.8% support and the weekly Starc- band now at 350
- The reversal in early May dropped the relative performance, or RS, below support at line b. The ensuing rebound back to line b was a good opportunity to sell
- The longer-term uptrend in the RS, line c, has now been broken, suggesting that this group is not ready to turn around
- The selling volume has picked up over the past three weeks, as the on-balance volume (OBV) has dropped further below its flat weighted moving average (WMA). Next good OBV support is at line d
- The coal index now has resistance in the 400-415 area
Given the strength of gold prices and the fact that the platinum futures made new highs in May, the 15.9% decline in the Dow Jones Platinum and Precious Metals index will likely be a surprise to some. The group peaked early in 2011 at 154 and has since declined steadily. It is the weakest group so far this year, down 37.7%.
- The first sign of weakness was a break of the uptrend in the RS, line f, which occurred in the middle of January
- The sharp rally in late February was the best opportunity to get out, as on the next decline, both the price and RS chart developed a pattern of lower highs and lower lows
- The weekly OBV formed a minor negative divergence at the highs (see circle) before dropping below its weighted moving average in March. It is well below its declining WMA and is now closer to strong support at line h
- The daily OBV (not shown) turned negative on January 5 and still looks weak
NEXT: Two More Lagging Industry Groups to Avoid
|pagebreak|The weak performance of the Dow Jones Banking index should be less surprising, as the group is down 13.6% over the past three months. The Select Sector SPDR - Financial (XLF) has demonstrated very weak relative performance since early in the year. The uptrend from last fall, line a, was broken in the middle of May.
- The group has been close to the weekly Starc- bands over the past several weeks, which increases the chances of a rebound. There is next good support in the 188 area, line b
- The RS analysis has been in a long-term downtrend since 2009 (line c), which is a sign of weakness. The rally failure in early 2011 created another downtrend in the RS, line d
- The weekly OBV is also in a well-established downtrend, line e, as it dropped back below its weighted moving average in February
- The daily OBV (not shown) did not give any short-term positive signals last fall, which was a negative sign. It is currently negative, but suggests the group may be sold out in the short term
- There is initial resistance at 210 with much stronger resistance in the 220-225 area
The Dow Jones US Internet index is down 11.7% over the past three months, essentially double the decline in the Spyder Trust (SPY). The group bottomed in 2008 ahead of the market, but it violated its uptrend, line g, in 2010.
- The failure in early 2011 to surpass long-term resistance (line f) was consistent with the lower highs in the RS analysis
- The RS analysis had broken support, line h, in early 2010, and then tried to form a new level of support, line i. In early April, this support was broken, signaling the recent drop in the group
- The weekly OBV formed a negative divergence in early 2011 and then violated its uptrend, line j, in March. It still looks very weak
- There is first resistance in the 375-400 area
What It Means: These four industry groups are ones that you hopefully have avoided this year. The weekly and daily analysis of the Dow Jones Banking index suggests it is overdue for a rebound, however, the intermediate-term analysis is negative for all four of these industry groups.
Good information is available on many Web sites, but I find some particularly useful information here.
How to Profit: Even though there are quite a few stocks in each of these industry groups that have done quite well this year, being in a weak sector or industry group is a distinct disadvantage. In the long run, you will be better off finding the strongest stocks in those industry groups or sectors with the best relative performance.
See related: Spot Leaders and Losers with RS Analysis


