Both the Materials and Industrials sectors look technically vulnerable, meaning investors should exercise caution and have tight stops in place.
Since the March 2009 lows, two of the best-performing sector ETFs have been the Select Sector SPDR - Industrial (XLI) and the Select Sector SPDR - Materials (XLB). XLI is up 148% from the March lows and XLB is up 117%, while the S&P is up 100%.
Of course, many of the individual stocks in these sectors have seen even more dramatic gains, and soon after the lows were formed, the relative performance analysis of these groups identified them as the star performers.
In the August 13, 2009 Trading Lesson, I noted that the S&P Industrials had completed a reverse head-and-shoulders bottom formation. The sector closed that week at 219 and hit a high last week of 336.
In that same article, I discussed the weekly analysis of the Materials sector, which had formed strong bullish divergences at the March 2009 low. The sector closed that week at 178 and hit a high in early April of 256. By early May, the technical picture had deteriorated (see “Will the Materials Slump Continue?”)
Both the Industrials and Materials sectors have now formed weekly negative divergences, which are consistent with a significant correction, but not a major top. By analyzing both the weekly and daily charts of the corresponding sector ETFs, we can get a better idea of the type of correction we should expect.
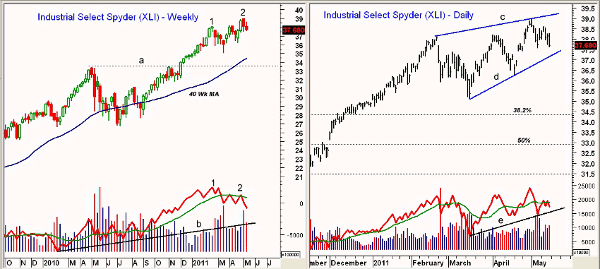
Chart Analysis: The weekly chart of the Select Sector SPDR - Industrial (XLI) shows that it made a new high the week ending May 6 at $38.98 (point 2) and then closed Friday just above the prior week’s low.
- This high was well above the February high of $38.08 (point 1)
- The weekly on-balance volume (OBV) made its high in February but formed a lower high in May (point 2), just barely making it above its flat weighted moving average (WMA). This is a negative divergence consistent with a top formation
- The divergence has been confirmed this week, as the OBV has dropped below its prior low and is now in a downtrend
- The weekly OBV support at line b is well below current levels
- Support for XLI on the weekly chart is at $34.44 and the 40-week moving average (MA). Chart support from the 2010 highs is at $33.50
The daily chart of XLI appears to show a rising wedge formation, lines c and d. A close below $37.17 will complete this formation.
- The chart formation has initial downside targets at $34.50 with the 38.2% retracement support at $34.35. The 50% support is at $32.90
- The daily OBV did make a new high with prices, but I have found the weekly OBV to be more important when the weekly and daily disagree
- Daily OBV has also just turned down from its weighted moving average, and a break of support at line e should precede a break of price support
- Short-term resistance is now at $38.60 and then $39.00
NEXT: Latest Chart Action for Materials Sector ETF XLB
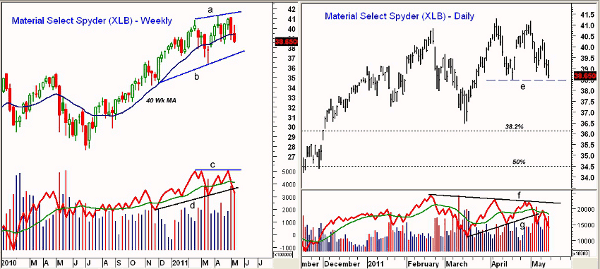
|pagebreak|The Select Sector SPDR - Materials (XLB) also formed higher highs in May, line a, but has reversed sharply in the past two weeks. It closed just above four-week support at $38.44.
- There is more important trend line support on the weekly chart at $37.45
- XLB is also below its 40-week MA, which has started to flatten out
- The weekly OBV failed to confirm the new price highs, as indicated by line c, and it violated its uptrend (line d) this week. This is negative and suggests a drop below the March lows at $36.44
- The volume over the past two weeks has been heavy
- Support on the weekly chart from the May 2010 highs is at $35.47
The daily chart of XLB reveals that Friday’s close was just barely above the support at $38.44, line e.
- The next support on the daily chart is at $36.44, which is just above the 38.2% retracement support, as calculated from the summer 2010 lows
- The 50% retracement support is at $34.50
- The daily OBV shows a series of lower highs, line f, and it broke its uptrend (line g) in early May
- Last week’s bounce in XLB took the OBV back to its declining weighted moving average, which is a bearish formation. The OBV is already below the April lows and appears to be leading prices.
What It Means: Clearly, the negative weekly technical outlook for these two sectors is consistent with a further market correction. Though it is possible—as we saw in the first quarter of the year—for the major averages to move higher when just a few sectors are strong, it isn’t easy.
As I discussed last week, both the energy sector and the financial sector look weak technically. This could make it difficult for the market to move higher over the next few weeks.
How to Profit: From the weekly analysis of these two important sectors, these stocks are likely to be the most vulnerable on a further market decline. Make sure that you have fairly tight stops in place if you are holding stocks in these sectors.
For XLI, I would look for a potential decline to the $33.50-$34.00 area over the next several weeks.
XLB looks even weaker, as it has been hit hard in the past week or so. I would look for a decline in XLB to the $34.50-$35.50 area.


