With the S&P 500 lagging other market indices, analysis of key market internals like the Advance/Decline (A/D) line helps to determine whether a bearish shift could be looming.
The strength of the global equity markets since the March lows has been impressive, but price action is just one component that can help determine whether the rally is broad based.
Historically, significant market tops are often highlighted by one market average—generally the narrowly based Dow Jones Industrials Average—surging to new highs while other broad market averages like the NYSE Composite or S&P 500 lag. So far, the Spyder Trust (SPY), which tracks the S&P 500, has failed to surpass its February highs, begging the question of whether investors should be concerned.
Besides price, I have found that a more accurate reading of the market’s health comes from the data on advancing and declining stocks. The most common way to look at this data is by calculating an Advance/Decline, or A/D line. This is a running total of the number of advancing stocks minus the number of declining stocks.
In a very bullish market, the A/D line will often be stronger than prices, and conversely, in a weak market, the A/D line will be weaker than prices. By analyzing the A/D lines of the major market averages and correlating with the major ETFs that track them, such as SPY, the Diamonds Trust (DIA), PowerShares QQQ Trust (QQQ), and the iShares Russell 200 Index (IWM), a more accurate picture of the market’s true strength or weakness can be determined.
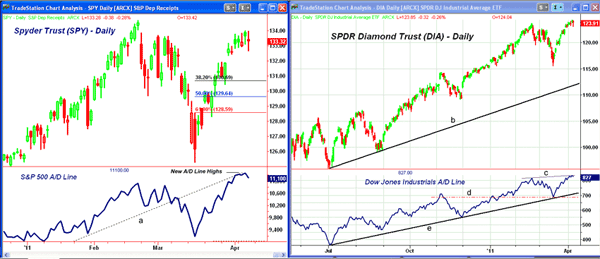
Chart Analysis: The daily chart of the Spyder Trust (SPY) shows that so far, the rally has stalled just 0.5% below the February 18 high at $134.69. Over the past few days, there has been little upward progress, as Thursday’s close was just barely above the close last Friday.
- SPY has short-term support now at $131.90-$132.30 and the rising 20-day exponential moving average (EMA)
- On a move above the February highs, the next major resistance from May 2008 is in the $140-144 area
- The initial 38.2% retracement support is at $130.69 with the 50% support at $129.64. This zone is the likely downside target on a decline from this week’s highs
- The S&P 500 A/D line has moved well above the February highs and is acting considerably stronger than prices
- The A/D line had broken its uptrend (line a) in early March and has now rallied back to this uptrend, which could be a short-term negative
The longer-term chart of the Diamonds Trust (DIA) gives a slightly different perspective. This week’s high in DIA at $124.36 was above the February peak of $123.64.
- On the upside, the 127.2% retracement target, as calculated from the February-to-March decline, is at $125.90 with the May 2008 high at $131.26
- DIA has initial support at $122.30 with further support at $121-$121.30, which corresponds to the 38.2% support calculated from this week’s high and the rising 20-day EMA
- Currently, there is more important chart support at $119.80-$120
- The Dow Industrials A/D line tested it long-term uptrend, line e, in March and has recently moved above the February highs, thereby confirming the price action. Important support for the A/D line is now at line d
NEXT: Latest Chart Analysis for Nasdaq 100 and Russell 2000 ETFs
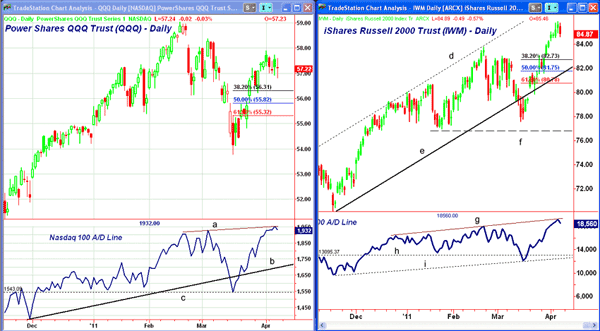
|pagebreak|The PowerShares QQQ Trust (QQQ), which tracks the Nasdaq 100 index, has been the weakest of the four market averages since the March lows. Its recent high on April 1at $57.90 is 1.9% below the February high at $59.04.
- QQQ has important resistance first at $58.26 to $58.37, which needs to be overcome to signal a test of the February highs
- If the February highs are exceeded, there is long-term resistance in the $64-$65 area with the major 50% retracement level from the 2000 highs ($120.50) at $70
- The Nasdaq 100 A/D line has made new highs this week (line a), suggesting that the market is internally stronger than the price action indicates
- The uptrend in the A/D line (line b) was broken just before the March lows, but more important support at line c did hold
- Using the April 1 highs, the 38.2% support is at $56.31 with the 50% level at $55.82. A break below $54.82 would suggest a test of the March lows
The strength in the iShares Russell 2000 Trust (IWM), which tracks small cap stocks, has been the most surprising, as it is up 10.7% from the March lows. More importantly, this week’s highs have surpassed the all-time highs from July 2007.
- The upper trend line resistance (line d) for IWM is currently at $87.50
- IWM closed a bit lower on Thursday with initial support at $83.77-$84 and the February highs
- The 38.2% support level from the recent highs stands at $82.73, followed by the 50% support at $81.75, which also corresponds to the daily uptrend, line e
- The Russell 2000 A/D line lagged the market in February, which was a reason for concern since it just made marginal new highs in February
- The A/D line did make further new highs this week, line g, but it’s lagging the price action. Good support for the A/D line is now found at lines h and i
What It Means: Analyzing the market internals is critical for investors because when the A/D lines are confirming the price action, a greater exposure in the equity markets is warranted. From a historical perspective, most bear markets are preceded by divergences between the A/D line and the market averages.
The broadest measure of the market is the NYSE Composite, and it has also moved slightly above its February highs while its A/D line has been stronger.
A widely followed short-term A/D indicator is the McClellan Oscillator, which has turned down from +160. Overbought levels are generally in the +200 to +300 range. The McClellan Oscillator bottomed at -261 on March 16. It often bottoms during a correction in the -150 area.
How to Profit: The confirmation from the A/D lines suggests that the next correction will be well supported at the retracement levels and will set up a good buying opportunity.
The only negative reading from the market internals is the failure of the NYSE high/low data to confirm the price action. This indicator is less reliable than the A/D line, but it is still a concern. I am keeping an eye out for a surge in the number of new lows, which would be more negative.
The strength of the Nasdaq 100 A/D line suggests that it may be the best performer on the next rally. This is consistent with the sentiment readings, as many analysts are currently skeptical about the tech sector. The S&P 500 should also perform better on the next rally.
All four of the above ETFs have very liquid option markets, and this unique A/D data from Tradestation.com can be a valuable tool for option traders and can help to identify both the strongest and weakest market averages for their option strategies.
I have written extensively about the A/D line, and if you would like to learn more, please read “Using Market Internals to Time the Market.”


