Gold again exploded to new all-time highs yesterday, and gold mining stocks appear to be a good way to play this leg of the rally. Here are risk-controlled entry points for two more promising miners.
The action on Tuesday in the gold futures and in the Spyder Gold Trust (GLD) was impressive, suggesting that that three-month trading range is over and that gold is starting a new leg to the upside.
Volume was strong in gold as well as in the gold miners, and at this point, gold miners like Yamana Gold Inc. (AUY) and Agnico-Eagle Mines Ltd (AEM) have the most favorable risk/reward profiles.
The Market Vectors Gold Miners ETF (GDX) does not have as much upside potential, while GLD is likely to remain quite volatile.
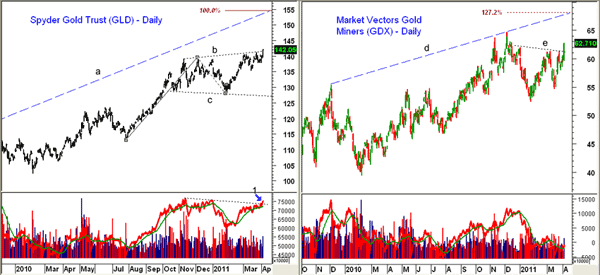
Chart Analysis: The volume analysis of the Spyder Gold Trust (GLD) early in 2011 suggested that it was ready to correct, and the fund did drop sharply into the end of January before developing a broad trading range, which has now been resolved by the close above resistance at line b.
- The initial retracement target is at $143.20 with subsequent targets in the $147-$148 area
- If GLD’s rally from the recent lows is equal to the rally from the July lows to the December highs, the 100% target is at $154.80, which coincides nicely with the upper resistance at line a
- The key support level to watch is now at $137.60, and a drop below this level will strongly indicate that this was a false breakout. There is further support at $135.23
- The daily on-balance volume (OBV) has just moved through six-month resistance (point 1). The weekly OBV (not shown) has not yet surpassed the December highs, but it is above its weighted moving average (WMA)
The Market Vectors Gold Miners ETF (GDX) has been lagging the price of gold as it is still 3% below the early-December highs at $64.62. Tuesday’s strong close above resistance (line e) is quite positive.
- Once above the December highs, GDX has converging upside targets in the $68 area. This is the 127.2% retracement target using the recent decline as well as the upper resistance at line d
- There is initial support now in the $59.40-$60 area with more important support at $58. A close back below this level would be negative
- There is longer-term chart and trend line support now in the $54.70-$56 area
- Volume picked up nicely on Tuesday, but while the OBV is above its weighted moving average, it has not yet confirmed the breakout. The weekly volume is also above its WMA
NEXT: The 2 Most Promising Gold Mining Stocks and Levels to Buy Them
|pagebreak|Yamana Gold Inc. (AUY) is a Canadian gold mining company with interests mainly in South America. It has been an underperformer for the past few years even though it is reported to have the lowest cost of production of around $103 per ounce of gold.
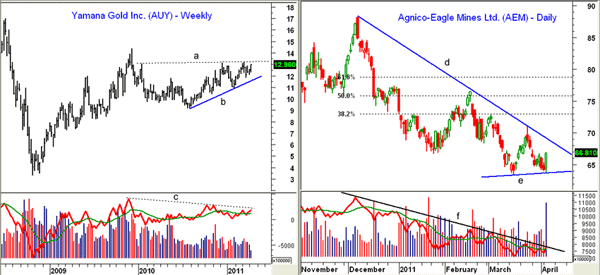
- The weekly chart of AUY shows a tight range over the past 15 months with key resistance (line a) now at $13.25. A move above this level will indicate a test of the 2009 highs at $14.37
- The 127.2% retracement target is at $15.80 with longer-term chart resistance at $17 and then the 2008 highs at $19.93
- Initial chart support is at $12 with the weekly uptrend (line b) in the $11.60 area
- The weekly OBV was stronger than prices in 2010 and is close to overcoming the key resistance at line c. Both the weekly and daily OBVs are above their weighted moving averages
Agnico-Eagle Mines Ltd (AEM) is an $11 billion, Canadian-based mining company with interests in Canada, the United States, Finland, and Mexico. Its cost of production is reported to be just over $400 per ounce. AEM peaked in December at $88.20 and now appears to have completed a double bottom in the $63.53-$63.85 area.
- The strong close on Tuesday amid heavy volume should complete at least a short-term bottom (line e) with the downtrend (line d) at $69 and further resistance at $71
- The 38.2% retracement resistance is at $73, but there is more important chart resistance and the 50% retracement level at $75.80-$77.38
- The weekly OBV will turn up this week and the daily OBV has moved back above its weighted moving average
What It Means: Tuesday’s action does seem to be significant and the only thing that would change this would be if gold were to close $20-$25 lower in the next few days. Gold was up $7 in early-Wednesday trading.
When a market forms volume divergences, as was the case in early January, and sentiment is extreme, it can be resolved by either a decent correction to shake out the weak longs or a broad trading range that frustrates late buyers.
I had been looking for a further correction below the January lows despite the long-term bullish signals from the monthly OBV. In the past two weeks, the resiliency of the gold market had me turning more constructive on gold.
As far back as January 2009, I have had upside targets for the gold futures at $1602 that do not seem so far-fetched now. The technical action suggests that miners provide a more favorable risk/reward profile at this time than GLD.
How to Profit: On March 18, I wrote “Those who are concerned about their positions in GLD or those who bought in the past six months could hedge their long position in GLD by selling the May 138 calls against their longs at $3.80 or better.”
GLD closed on March 18 at $138.37 and the May 138 calls settled at $4.05. On Tuesday, April 5, GLD closed at $142.05 for a gain of $3.68 while the calls closed at $5.40 for a loss of $1.60.
Taking the gain from the long GLD and loss from the short May 138 calls, the net was a gain of $2.08.
If you sold calls against your longs, I would buy them back now. I like the gold miners better, but for those who want to trade GLD, buy at $140.92 with a stop at $136.92 (risk of approx. 2.8%). On a move above $143.30, raise the stop to $139.33.
For GDX, I would buy at $60.74-$61.53 using a stop at $57.91 (risk of approx. 5.6%). On a move above $58.20, raise the stop to $52.23.
I think AUY has the best opportunity to surprise the market on the upside. Go 50% long at $12.93 and 50% long at $12.67 with a stop at $11.93 (combined risk of approx. 3%). On a move back above $13.30, raise the stop to $12.29 and sell half the position at $13.86 or better.
For AEM, go 50% long at $66.64 and 50% at $66.24 with a stop at $62.89 (combined risk of approx. 6.6%). On a move above $71.05, raise the stop to $64.46 and sell half the position at $72.84.


