Tech stocks have been hit hard recently, and the charts predict further weakness ahead, but this correction may set up a favorable buying opportunity in sector giants like Apple or Google.
Less than two weeks after the market peaked on February 18, there was evidence that the technology sector was becoming weaker than the S&P 500. It had also lagged last summer while the market was correcting, but this changed in September 2010 (see “Materials and Tech Close Strong”) and technology was a strong performer last fall.
The daily analysis of the Select Sector SPDR - Technology (XLK) suggest it can still correct further over the coming weeks. This is also the case for two of the most widely watched stocks, Google Inc. (GOOG) and Apple Inc. (AAPL), but should you be looking to buy either over the next few weeks?
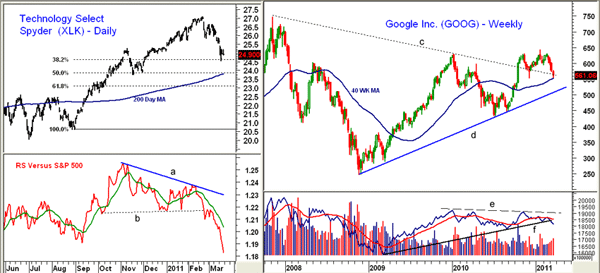
Chart Analysis: The Select Sector SPDR - Technology (XLK) dropped slightly below the 38.2% support level on Wednesday and is now trying to rebound. With Friday’s close, XLK is down 8.1% from the recent highs.
- The daily chart still shows a positive pattern of higher lows and higher highs, with important support now at $23.74-$24. This corresponds to the 50% support level as well as the rising 200-day moving average (MA)
- The relative performance, or RS chart, formed a lower high (line b), which was a short-term negative for the sector. The break below support at line c on February 22 confirmed that the sector was now weaker than the S&P 500
- Initial resistance is now at $25.84-$26 and a close above $26.40 is needed to stabilize the near-term outlook
Google, Inc. (GOOG) slightly surpassed the January 2010 highs early in the year but is down about 11% in the past four weeks. In fact, if you go back to 2006, you will note that GOOG has often peaked in either late December or early January.
- GOOG is already back to its rising 40-week MA with a stronger band of support in the $512-$536 area. This corresponds to the weekly uptrend, line d
- The weekly on-balance volume (OBV) did not make new highs early this year, and this negative divergence (line e) suggested GOOG was vulnerable on the downside
- As the market was making new highs in February, the OBV was testing its flat weighted moving average (WMA) and has now broken its uptrend, line f, which does favor further weakness
- There is initial resistance now at $580 with stronger resistance in the $595-$620 area.
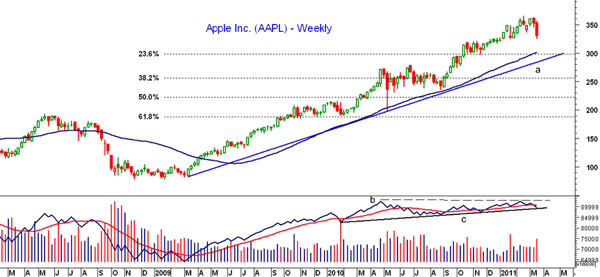
Apple Inc. (AAPL) did make new highs with the market in February at $364.90, but the stock closed Friday at $330.67, down 9.4% from those highs. The weekly pattern of higher highs and higher lows is positive for the major trend, but last week’s sharply lower close confirms a negative short-term outlook.
- There is next minor support in the $320 area with the 23.6% retracement support and the rising 40-week MA now in the $300 area
- The weekly uptrend, line a, is currently at $285, which is not far above last summer’s highs at $279
- The weekly OBV made marginal new highs in February, confirming the price action. The OBV is now below its weighted moving average but so far is holding above more important support at line c. A decisive break of this level would be more negative
- The daily chart shows that selling last week was moderately heavy and the daily analysis does favor a further decline. Initial resistance is now at $345 and a close above $356.50 would be the first indication that the correction is over
What It Means: The weaker relative performance of the technology sector, as well as that of the small and mid-cap stocks, suggests that the market’s current correction/consolidation period will last a bit longer. The intermediate-term analysis of GOOG suggests it is likely to be vulnerable for some time, while the pullback in AAPL is likely to set up a buying opportunity.
How to Profit: The sharp drop in technology stocks does not yet suggest that this sector has formed a major top, but it will be important that the November lows in the technology sector hold on a closing basis. Two other leading sectors are also well below their highs with the Select Sector SPDR - Industrial (XLI) down 5.5% and the Select Sector SPDR - Materials (XLB) down 7.6%. Both have held up a bit better than XLK.
Once the stock market stabilizes, it will be important to watch these three sectors to see if there has been a change in leadership. I have no recommendation for GOOG at this time, and for AAPL, since the daily analysis is negative, I would only look to buy at next strong support. Specifically, buy AAPL at $303-$306.90 with a stop at $294.70 (risk of approx. 4%).


