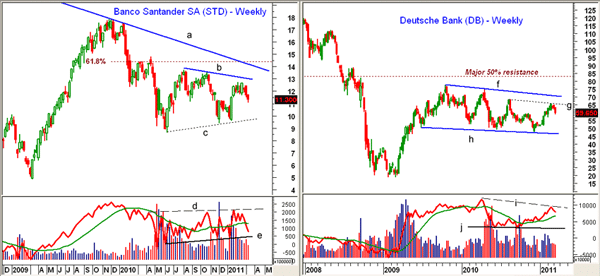
Planned stress tests by the new European Banking Authority are designed to increase confidence in this troubled sector, but the charts of these two banks suggest they may need more help than that.
The initial stress tests of the euro banks were widely criticized after two Irish banks that passed the tests needed to be bailed out shortly thereafter. The new testing criteria are scheduled to be released next month and will supposedly test the banks for the impact of an “extremely negative macroeconomic situation.” These two large European banks may need more than passing the stress tests to ignite investor interest.
Chart Analysis: Banco Santander SA (STD) peaked in 2009 at $17.89, which was well below the May 2008 highs at $22.27. The long-term downtrend from these highs (line a) is now at $14.13.
- The initial trend line resistance, line b, is now just above $13, and that level would have to be overcome to improve the technical outlook. The 61.8% resistance from the 2009 highs is at $14.41
- The weekly chart shows an apparent continuation pattern (lines b and c) which, if completed, would have downside targets in the $5-$6 area
- Initial support is now at $10.35-$10.85 and a violation of the $9.42-$9.63 level (line c) would be quite negative
- The weekly on-balance volume (OBV) has dropped back below its weighted moving average (WMA) and has important support at line e
Deutsche Bank (DB) bottomed below $20 per share in February 2009, then rallied sharply to a high of $77.49 in October 2009, and has been locked in wide range ever since.
- The rebound from the 2009 lows has failed to even reach the 50% resistance of the decline from the 2007 highs, which is at $145.77. Therefore, the entire rally appears to be a rebound within the downtrend.
- The weekly pattern (lines f and h) reflects a series of lower highs and lower lows, and last week’s lower close does not help. DB needs to move above resistance (line g) at $65.78 to improve the outlook
- Next support is in the $57 area with stronger support at $55. A break of support at $47 (line h) would be very negative with downside targets in the $20-$25 area
- The weekly OBV shows a pattern of lower highs, line 1, and a drop back below its weighted moving average would support the bearish case
What It Means: The recent downgrade of Spain’s debt raises the potential for more European debt problems down the road. The new stress tests are unlikely to reverse the downside pressure on the banks, and STD and DB are two of the weaker charts.
How to Profit: While some investors and advisors are looking to the banks stocks in hopes that they will be able to raise their dividends, clearly, I would wait to buy some of the key US or European banks until there is improvement in the technical outlook.
Bank of America (BAC) and Citigroup (C) are still in short-term downtrends as noted recently. (See “Don't Bank on Bank of America, Citigroup.”) Both bank stocks need to overcome their February highs to improve the technical outlook.
On February 15, I recommended avoiding Lloyds Banking Group plc (LYG) and The Royal Bank of Scotland Group (RBS). (See “The Two Worst British Banks.”) Both continue to look weak and are down 9.3% and 4.7%, respectively. They also now have key resistance at the highs made in mid-February. I would wait for a break of key support before getting aggressively short either STD or DB as well.


