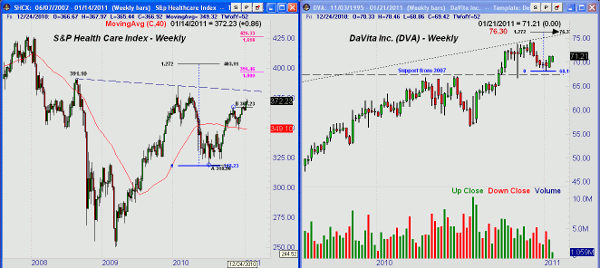
Chart Analysis: The S&P Health Care Index closed last week on its highs and looks poised to break out above resistance at 380. This should mean that it will then challenge the 2008 highs at 391.10. Most of the other sectors have already overcome their corresponding resistance levels.
- A rally from the November lows that is equal to the August-to-November rally has an upside at 396.46
- A 127.2% retracement of the decline from the early-2010 highs to the summer lows has a target at 403.11, which is over 8% above current levels
- Initial support is now at 364 with good weekly support at 350
DaVita Inc. (DVA) provides services in dialysis centers and hospitals for those with severe kidney diseases. DVA made a high on December 1 at $74.61 before declining to a low of $68.14 on January 7.
- DVA held above the 38.2% support level at $67.76
- Major support from 2007 is at $67.40
- Friday’s close above the prior three-week highs is a positive sign
- Volume was strong on Friday, confirming the price action
- There is upper trend line resistance at $75.30 with the Fibonacci 1.272 target at $76.30
What It Means: Though health care is normally a more “defensive” sector, maybe it is benefiting from the stock market’s relentless rally as investors see too much risk in some of the other sectors that are up sharply over the past month.
How to Profit: I prefer individual stocks as opposed to one of the healthcare ETFs like the Health Care Select Sector Fund (XLV). The strong weekly close in DVA and the good support nearby makes it an attractive stock in a sector that seems to be gaining relative strength. Buy DVA at $70.26-$70.66 with a stop $67.17. First upside target is between $75.30 and $76.30.
Tom Aspray, professional trader and analyst, serves as senior editor for MoneyShow.com. The views expressed here are his own.


