Stocks that are in the news and the market indices themselves often gap up or down in the morning, creating good trading opportunities, and Scott Andrews presents charts and real examples of how to "fade" gaps for profit.
Talking with Scott Andrews today. Scott, we’ve got gaps abounding in this market as it continues to deteriorate. Should you fade or follow them?
Well, I’m a gap fader. You can follow gaps. Following the gap means when the gap is up, you’d go with it; you’d go long. So if you get a gap up in a stock, like a biotech stock or a big momentum stock, people often go with, or follow, those gaps.
I’m more of a fader; I go the opposite direction. So if the gap is up, I’m shorting it; or if the gap is down, I’m buying if it meets my criteria.
This market has been really good for fading the gap because the market had been basically range bound, and it works really well with indices.
So, just to show you visually what fading the gap is, because that confuses people sometimes.
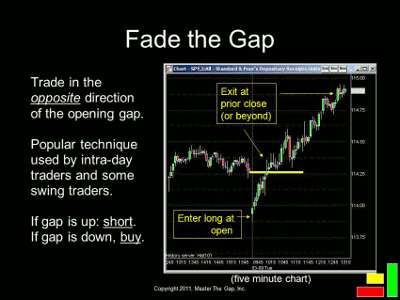
If you can see here on this slide, this is an example of a gap down in the Spyder Trust (SPY); it’s a five-minute chart, and you can see it march up dutifully. I wish they all did that, but they don’t.
It filled the gap; that yellow line is the prior day’s close, and this particular one kept on moving to the upside, which is another thing I like to do is trade not only to the gap-fill area, but through the gap-fill area if the historical probabilities are supportive.
And now where does it take you from there?
Well, when it gets there, I’m done. I’m done for the day, so I don’t really think of myself as a daytrader, but technically I am because I’m in and out the same day.
I trade about 100 gaps a year in primarily the S&P 500, so every two or three days, I have a high-probability set-up fading the gap.
Are there some times that you are out of the market?
Sure. Two to three times a week I’m not fading that gap at all. I just leave it alone. There’s no real historical or compelling edge for me to risk my time and capital.
NEXT: Identify the Highest-Probability Gap Trade Set-ups
|pagebreak|And certainly because the market has deteriorated these past few weeks, there are more opportunities, but in a trending market up, are there as many opportunities?
There are. The gaps are fairly consistent in terms of the frequency of them. In a given month, out of 22 trading days, there are probably 18-20 tradable gaps.
The problem is when the market trends really hard in one direction or the other, you can sometimes break historical norms, so I like to look at every set-up in several different ways, the foundation of which is where the gap opens relative to the prior day’s open, high, low, and close. I call that an opening zone.
Can you go through that a little bit more?
Sure. In fact, I can show you on this next slide what I mean by that:
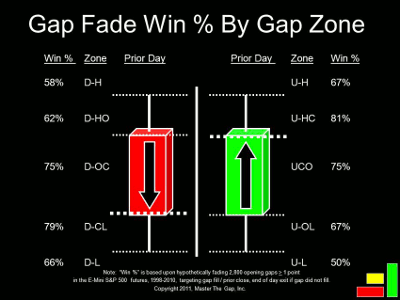
This is sort of a busy slide, but if you take your time and look from left to right, you’ll see there’s a red candlestick there. That represents a daily bar, and the high, open, close, and low create five different zones. I have a nomenclature; you don’t have to worry about that, but the key point is on the far left, the win percentage.
It changes quite dramatically as you go down the left, so the very top-left corner, the 58% win rate of all gaps that open above the prior day’s highs following a down day will fill by the end of the day, meaning they’ll go back to the prior day’s close.
That’s not all that high, actually, because the historical norm is about 70%, but as you get closer, get to the zones that are a little bit closer in proximity to the prior day’s close—like that big one in the middle, the D-OC or doc zone—75% of all gaps that have opened there after a big red candlestick day have filled, and that’s normally a pretty good zone to fade.
See video: The Best Gap Trades on the Market
Related Reading:


